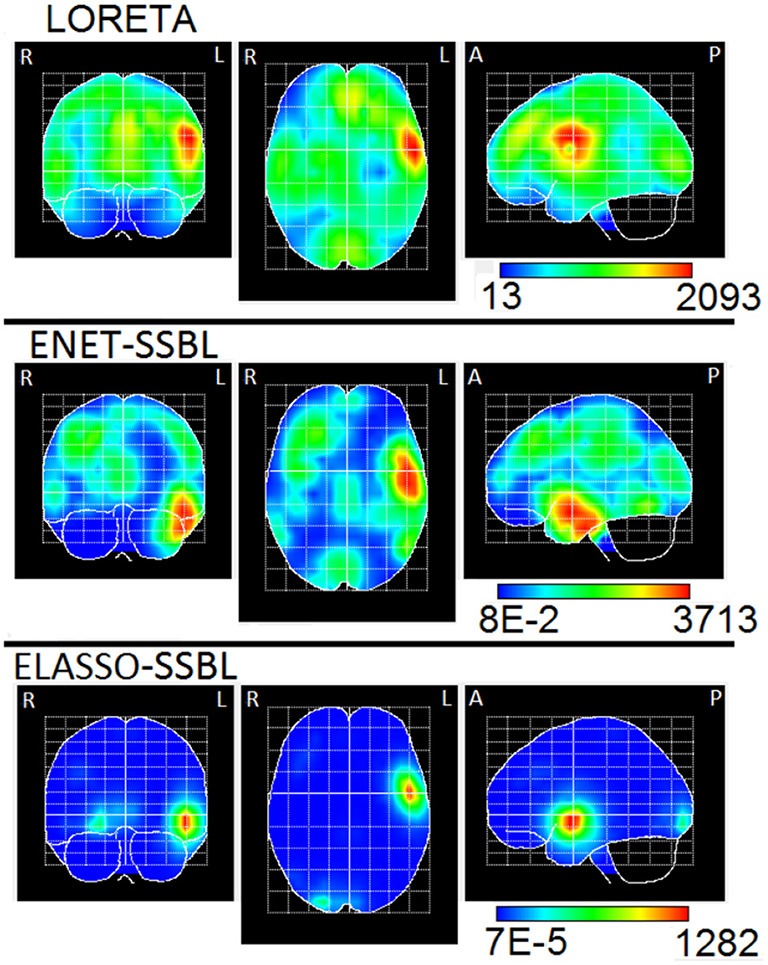
Figure 13.

Maximum intensity projection of the PCD estimated with LORETA, ENET-SSBL, and ELASSO-SSBL, at the global positive maximum potential (time C in Figure 9). The three orthogonal planes are the coronal (left), axial (center) and sagittal (right) views. R, L, A, P stand for Right, Left, Anterior, Posterior, respectively.
