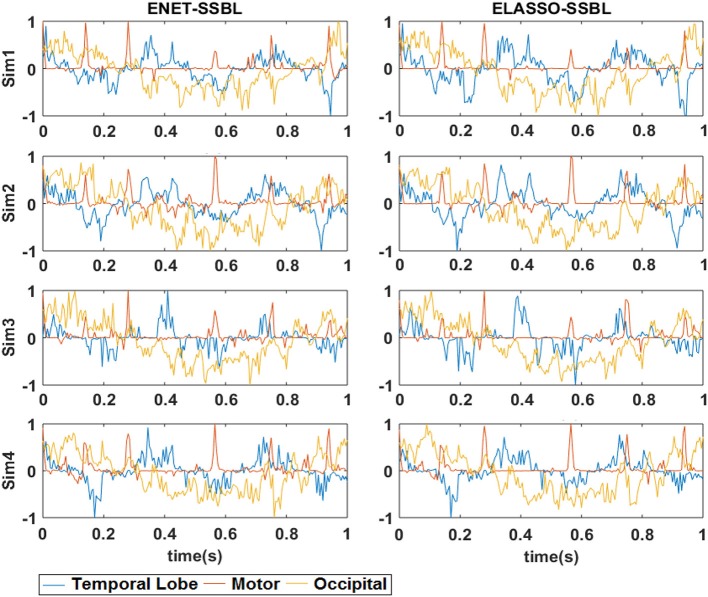
Figure 5.
Estimated temporal courses with SSBL algorithm for the two proposed models ENET and ELASSO. The curves show the normalized temporal courses of the average activation across all voxels belonging to each of the three simulated spatial patches: Occipital (yellow), Temporal Lobe (blue), and Motor (red). These correspond to the same typical trials as Figure 4, for each of the 4 simulated configurations (Sim1, Sim2, Sim3, and Sim4).

