Fig. 1.
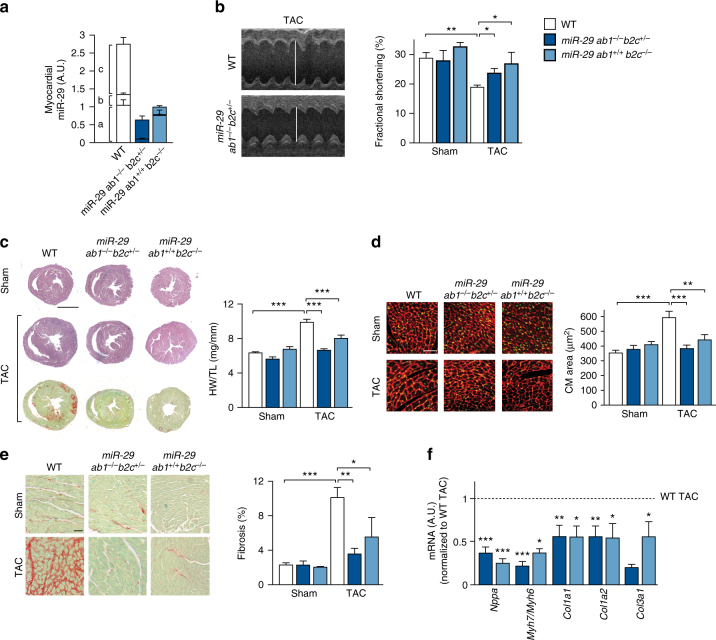
Genetic deletion of miR-29 in a mouse model for left ventricular pressure overload. a Expression of miR-29 family members in left myocardium from wildtype (WT), miR-29 ab1 −/− b2c +/− and miR-29 ab1 +/+ b2c −/− mice; n = 4–6 mice/group. b Echocardiographic analysis of fractional shortening as a measure of left ventricular function; n = 4–10 mice/group. A Student’s t-test was used to calculate the P values. c (Left) Representative stainings of myocardial tissue from WT or knockout mice (tissue fixation 21 days after sham surgery or transverse aortic constriction, TAC) by hematoxylin/eosin and Sirius Red/Fast Green stainings. Scale bar: 2 mm. (Right) Ratio between heart weight and tibia length (HW/TL) as a measure of cardiac hypertrophy; n = 6–14 mice/group. P values were determined by two-way ANOVA followed by Bonferroni’s post hoc test. d (Left) Representative wheat germ agglutinin (WGA)-staining of midventricular sections to assess hypertrophy of cardiac myocytes. Scale bar: 50 µm. (Right) Quantitative analysis; n = 5–8 mice/group. P values were calculated using two-way ANOVA followed by Bonferroni’s post hoc test. e (Left) Representative image sections from Sirius Red/Fast Green-stained myocardium of the indicated groups and (Right) quantitative analysis of fibrosis; n = 3–11 mice/group. P values were determined by two-way ANOVA followed by Bonferroni’s post hoc test. f Real-time PCR quantification of markers for cardiac remodeling in left ventricular tissue from WT, miR-29 ab1 −/− b2c +/− and miR-29 ab1 +/+ b2c −/− mice. Collagen mRNAs and the following markers of cardiac myocyte hypertrophy were assessed: Nppa, atrial natriuretic peptide; Myh7/Myh6, ratio of mRNAs encoding β- and α-myosin heavy chain. Tissues were collected 21 days after TAC surgery; data are from 4 to 9 independent experiments, with 2 replicates each. WT TAC means were compared to that of miR-29 ab1 −/− b2c +/− and miR-29 ab1 +/+ b2c −/− mice by a one-way ANOVA followed by a Bonferroni’s post hoc test. *P < 0.05, **P < 0.01, ***P < 0.001 for all panels. All quantitative data are reported as means ± SEM

