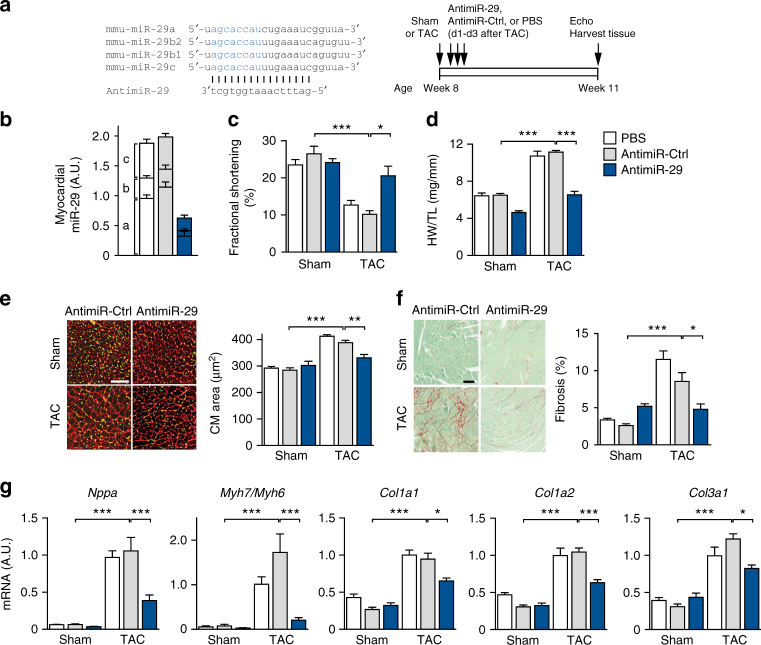
Fig. 2.
Pharmacological inhibition of miR-29 prevents cardiac remodeling and dysfunction. a (Left) Design of the miR-29 family inhibitor (antimiR-29). Sequences of miR-29a, b1, b2 and c display a high degree of sequence similarity with identical seed regions (depicted in blue), thus permitting the design of a single antimiR molecule. (Right) Design of the study. b Cardiac expression of miR-29 family members in mice, determined weeks after the first injection of antimiR-29, a control molecule (antimiR-Ctrl) or PBS. c Echocardiographic analysis of left ventricular fractional shortening in sham-/TAC-operated mice 3 weeks after injection with antimiR-29/-ctrl or PBS (determined by echocardiography), indicating reduced TAC effects in the antimiR-29-treated group. d Heart weight-to-tibia length ratio and e WGA staining of left ventricular tissue from mice described in c for determination of cardiac and CM hypertrophy. f (Left) Representative left ventricular sections stained with Sirius Red/Fast Green of the indicated treatment groups and (right) quantification of interstitial fibrosis. g Quantitative real-time PCR analysis of molecular markers for cardiac myocyte hypertrophy (Nppa, Myh7/Myh6) and of fibrosis-associated collagens. All scale bars: 50 µm. All quantifications derive from n = 5–14 mice/group, PCR performed with 2 replicates each. All quantitative data in panels c–g are reported as means ± SEM. *P < 0.05, **P < 0.01, ***P < 0.001 determined by two-way ANOVA followed by Bonferroni’s post hoc test

