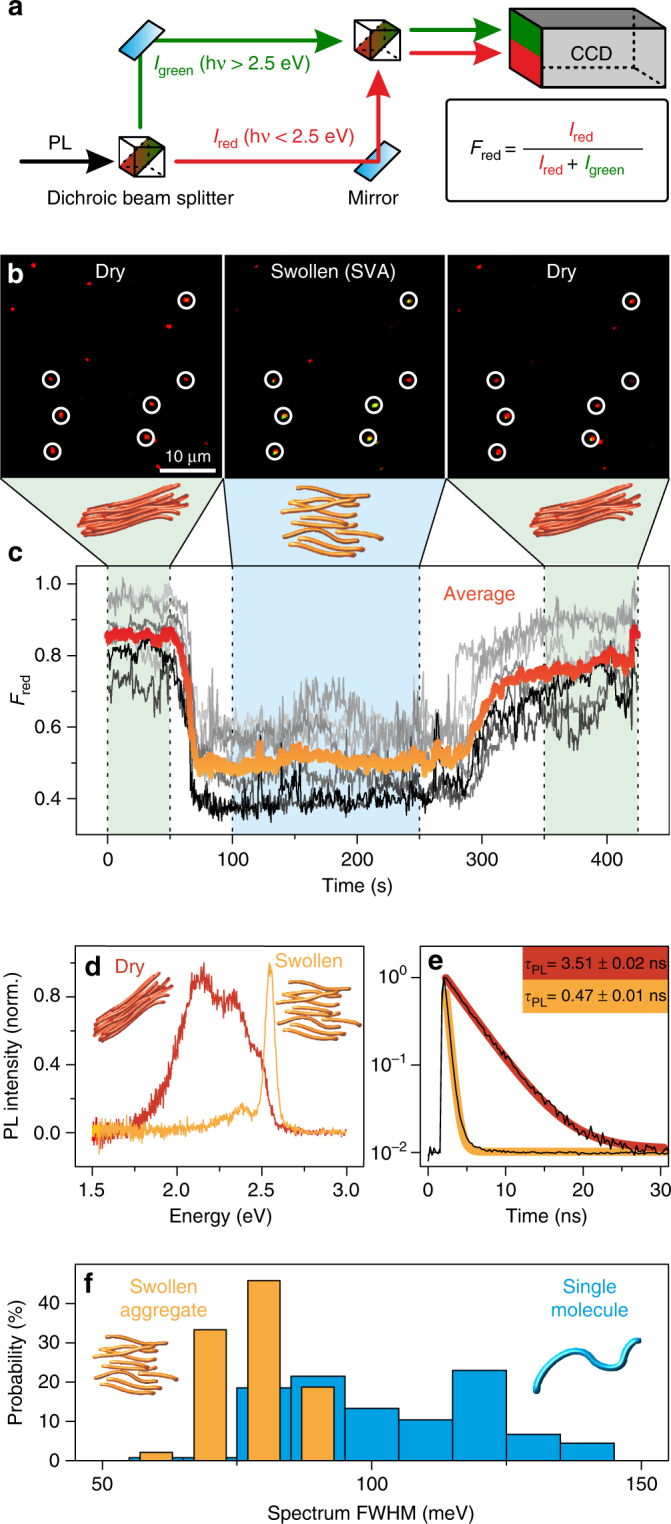
Fig. 2.

Switching between H-type and J-type coupling using solvent vapor annealing. a Schematic illustrating the splitting of single-spot PL with a dual-view unit into two detection channels, for photons with hv > 2.5 eV (denoted I green) and hv < 2.5 eV (denoted I red), and imaging onto different areas on the same CCD camera. The fraction of red emission for each single spot is defined as F red. b Accumulated wide-field dual-view fluorescence microscopy images of PPEB-1 aggregates of the same area from a 425 s movie during which the film conditions were changed. The first frame is accumulated during the first 50 s, the second frame at time 100–250 s and the last frame at 350–425 s. The z-scale is the same for all images. The first and the last frame are measured under ambient conditions and the central frame was obtained during SVA with a 1:4 ratio of toluene and hexane nitrogen vapor. Seven aggregates are marked with white circles. c Evolution of F red values with 500 ms time resolution from the seven aggregates (gray curves) and their average (red/orange curve). d, e Normalized PL spectra and transient PL decays of a single aggregate in a dry (red) and swollen state (orange). The PL decays are fitted by a single-exponential function with an offset to extract the PL lifetime. f Histograms of the full width at half maximum (FWHM) of the PL spectra of 89 swollen PPEB-1 aggregates (orange) and 131 PPEB-1 molecules (blue) (all individual spectra are shown in Supplementary Fig. 1)
