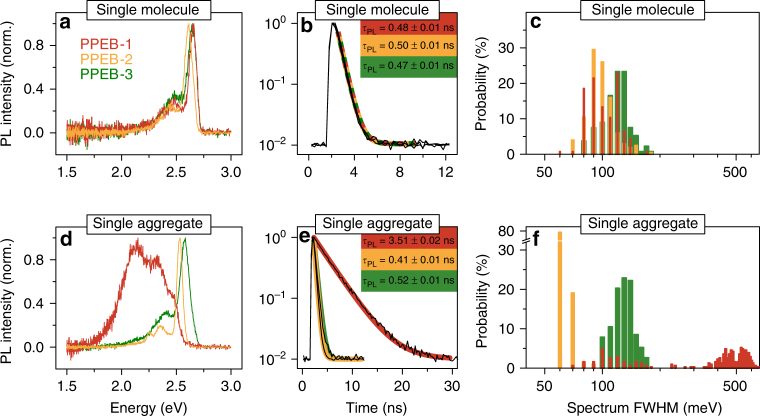
Fig. 4.
PL spectra and PL decays of single chains and single aggregates. Normalized PL spectra, transient PL decays, and spectral FWHM values extracted from the spectra in Fig. 3 and plotted in a histogram with 10 meV bin size for single molecules a–c and single aggregates d–f of PPEB-1 (red), PPEB-2 (orange), and PPEB-3 (green) in PMMA measured in air. Transient PL decays were fitted with an exponential plus an offset to account for the background, yielding the PL lifetimes stated in b and e

