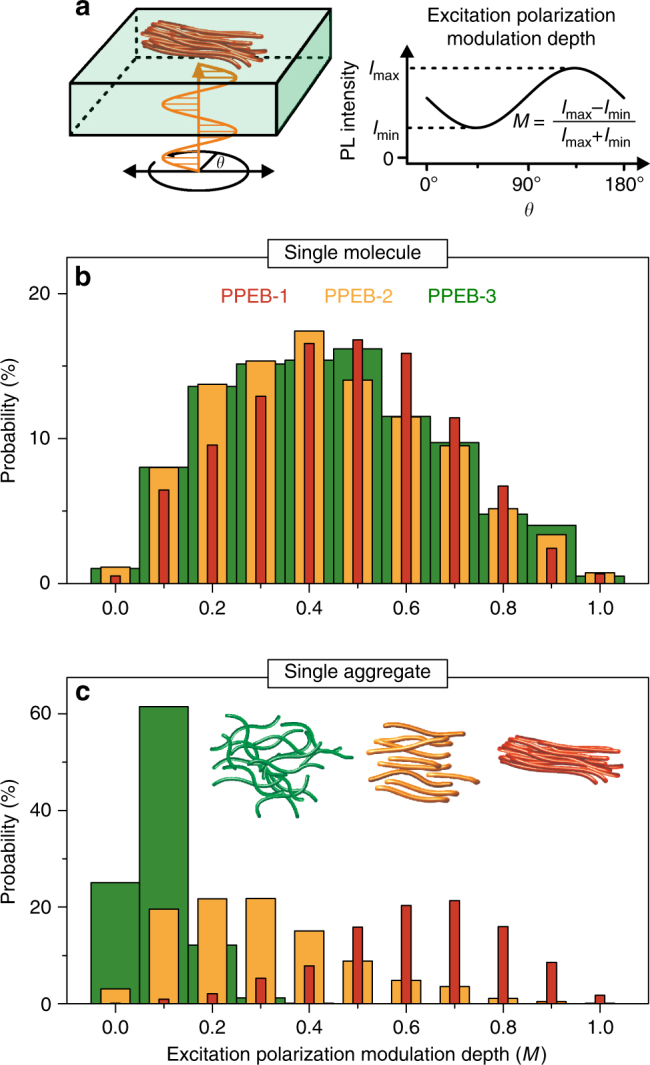
Fig. 6.

Morphology of single chains and isolated aggregates. a Sketch of the excitation polarization measurement technique and definition of the modulation depth, M. b M values for single chains and isolated aggregates c of the three samples measured in air. The spacing between the bars is varied for clarity and the histograms are normalized to the overall number of measurements (single chains: 1097, 1766, 977; aggregates: 743, 1062, 772) of spots yielding the probability of measuring a particular M value
