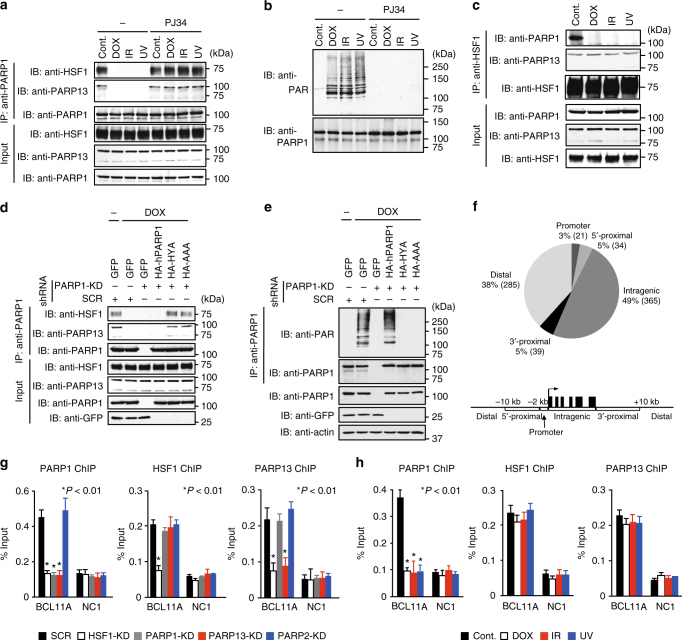
Fig. 2.
PARP1 activity regulates HSF1–PARP13–PARP1 ternary complex formation. a Extracts of cells treated with DOX, IR, or UV in the presence or absence of PJ34 were subjected to PARP1 immunoprecipitation, and then to immunoblotting. b Denatured extracts of cells treated as described in a were subjected to PARP1 immunoprecipitation, and then to immunoblotting using PAR antibody. c Extracts of cells treated as described in a were subjected to HSF1 immunoprecipitation, and then to immunoblotting. d Cells, in which endogenous PARP1 was replaced with wild-type or its inactive mutant, were treated with DOX. Cell extracts were subjected to PARP1 immunoprecipitation and immunoblotting. e Denatured extracts of cells treated as described in d were subjected to PARP1 immunoprecipitation, and then to immunoblotting using PAR antibody. f Genomic distribution of PARP1. ChIP-seq analysis was performed using LMB-treated cells overexpressing HA-hPARP1 and hHSF1-HA, and a total of 744 PARP1 peaks were identified. Percentages and numbers of PARP1 peaks at genomic regions relative to nearby genes are shown. Among 744 PARP1 peaks, only 10 peaks (Intragenic, 4; 3′-Proximal, 1; Distal, 5) were identified after PARP13 knockdown. g ChIP assay of PARP1, PARP13, and HSF1 at BCL11A locus in HeLa cells, in which PARP1, PARP13, HSF1, or PARP2 were knocked down. ChIP-qPCR on the peak region (BCL11A) and negative control region (NC1) was performed (n = 3). h ChIP assay at BCL11A locus in HeLa cells treated with DOX, IR, or UV (n = 3). Mean ± s.d. is shown. Asterisks indicate P < 0.01 by Student’s t-test

