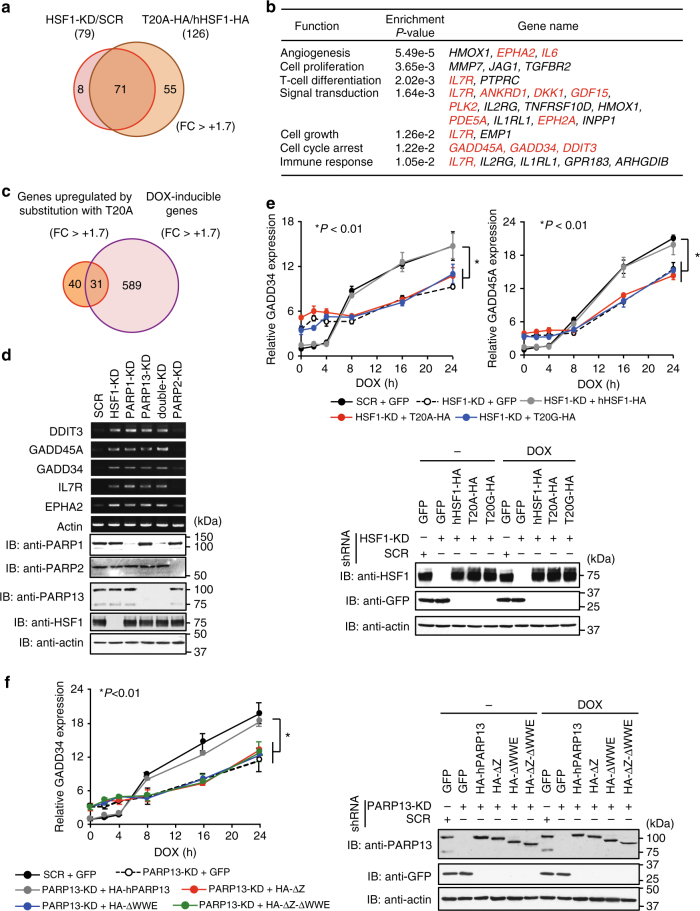
Fig. 3.
HSF1–PARP13–PARP1 enhances DNA damage-induced gene expression. a Venn diagram showing genes upregulated by HSF1 knockdown and substitution with hHSF1-T20A in HeLa cells (fold change > +1.7; P < 0.05; n = 3). b Gene ontology enrichment analysis of 71 genes upregulated by substitution with hHSF1-T20A. The P-values and gene names associated with each functional category are shown. Names of DNA-damage-inducible genes are indicated in red. c Venn diagram showing genes upregulated by DOX treatment and by substitution with hHSF1-T20A (fold change > +1.7; P < 0.05; n = 3). d Expression of DNA-damage-inducible genes in unstressed condition. RT-PCR analysis of five genes was performed using cells knocked down for HSF1, PARP1, PARP13, or both PARP1 and PARP13 (double-KD) (upper). Cell extracts were also subjected to immunoblotting (lower). e Expression of GADD genes in cells expressing HSF1 mutants. Cells, in which endogenous HSF1 was replaced with each protein, were treated with DOX for the indicated periods. GADD mRNA levels were quantified by RT-qPCR (n = 3) (upper). Mean ± s.d. is shown. Asterisks indicate P < 0.01 by ANOVA. Extracts from cells before and after treatment were subjected to immunoblotting (lower). f Expression of GADD34 gene in cells expressing PARP13 mutants. Cells, in which endogenous PARP13 was replaced with each mutant, were treated with DOX for the indicated periods. GADD34 mRNA levels were quantified by RT-qPCR (n = 3) (left). Mean ± s.d. is shown. Asterisks indicate P < 0.01 by ANOVA. Extracts from cells before and after the treatment were subjected to immunoblotting (right)

