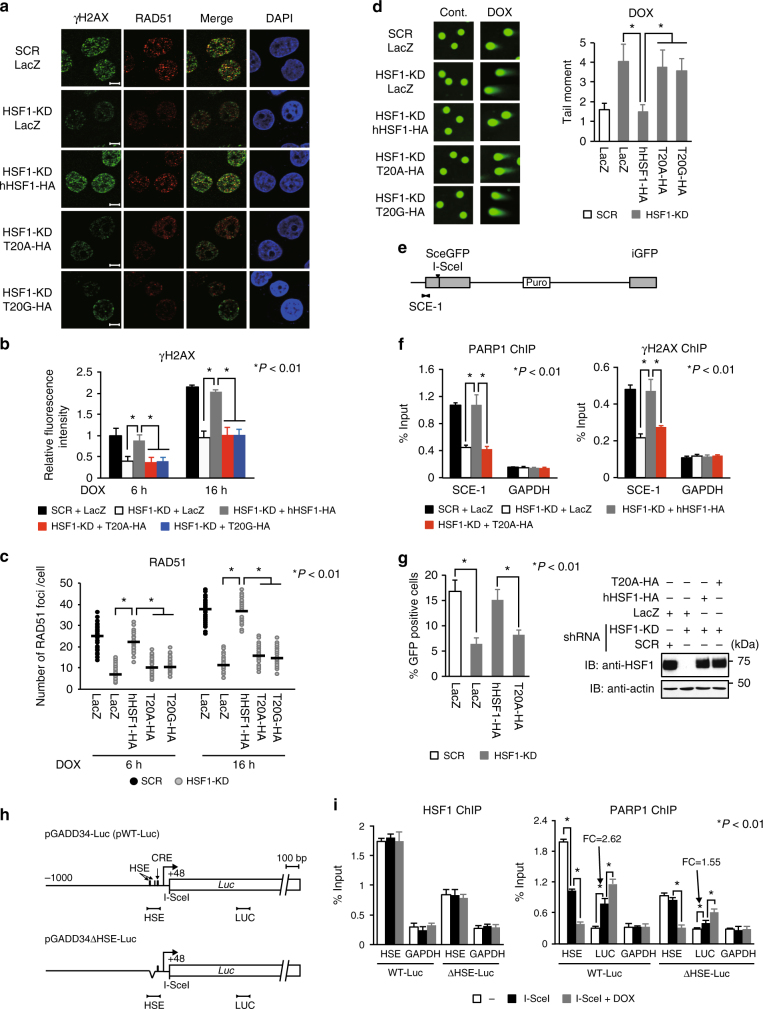
Fig. 6.
HSF1-mediated PARP1 redistribution promotes DNA repair. a–c HeLa cells, in which endogenous HSF1 was replaced with each mutant, were treated with 0.5 μM DOX, and then co-stained with γH2AX and RAD51 antibodies, and with DAPI. Fluorescence images, obtained using scanning confocal microscopy, and merged images (DOX for 16 h) are shown (a). Scale bar, 5 μm. Intensities of γH2AX fluorescence (b) and numbers of RAD51 foci (c) in 50 cells were estimated. Mean ± s.d. is shown. Asterisks indicate P < 0.01 by Student’s t-test. d Cells treated as in a were exposed to DOX for 2 h, and then recovered for 2 h. DNA damage in these cells was measured using a neutral comet assay (25 cells), and tail moment values are shown. Mean ± s.d. is shown. Asterisks indicate P < 0.01 by Student’s t-test. e Schematic structure of pDR-GFP reporter construct. SCE-1 region indicates an amplified region by ChIP-qPCR. f Accumulation of PARP1 and γH2AX in the SCE-1 region. HeLa-DRGFP cells, in which HSF1 was replaced as in a, were transfected with an I-SceI expression vector, and analyzed by ChIP assay (n = 3). Mean ± s.d. is shown. Asterisks indicate P < 0.01 by Student’s t-test. g Efficiency of HR repair. Numbers of GFP-positive cells among 200 cells were counted, and the percentages of these cells are shown (n = 3) (left). Mean ± s.d. is shown. Asterisks indicate P < 0.01 by Student’s t-test. HSF1 levels were examined by immunoblotting (right). h Schematic showing amplified regions, HSE and LUC, in the reporter constructs. The I-SceI cutting site is located upstream of the luciferase gene. The HSE and CRE elements are indicated. i Occupancy of HSF1 and PARP1 on the HSE and LUC regions during I-SceI treatment. The cells were transfected with pCBASce for 24 h, and ChIP-qPCR was performed. Some cells were treated with DOX for the last 8 h. Fold changes (FC) of PARP1 binding on the LUC region during I-SceI treatment are shown (n = 3). Mean ± s.d. is shown. Asterisks indicate P < 0.01 by Student’s t-test

