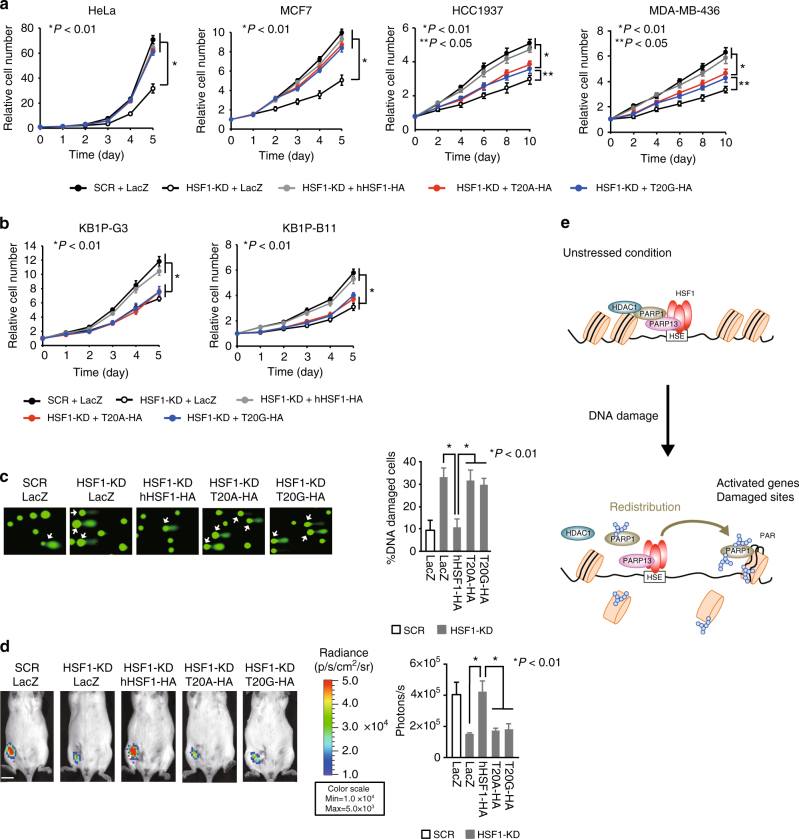
Fig. 7.
HSF1–PARP13–PARP1 protects cells from genotoxic stress. a Proliferation of human HeLa and three mammary tumor cells expressing hHSF1-T20A or hHSF1-T20G. Endogenous HSF1 was replaced with β-galactosidase (LacZ), hHSF1-HA, or its interaction mutants. Relative cell numbers at each time point are shown (n = 3). Mean ± s.d. is shown. Asterisks indicate P < 0.01 or 0.05 by ANOVA. b Proliferation of mouse KB1P-G3 and KB1P-B11 cells expressing hHSF1-T20A or hHSF1-T20G. Endogenous HSF1 was replaced as described in a, and relative cell numbers are shown (n = 3). c DNA damage in KB1P-G3 cells treated as in b was measured using a neutral comet assay. Percentages of cells with DNA damage showing DNA fluorescence in the tail (arrows) (100 cells) are shown (n = 3). Mean ± s.d. is shown. Asterisks indicate P < 0.01 by Student’s t-test. d Tumor growth of KB1P-G3 cells. KB1P-G3-luc cells treated as in b were injected into the fourth left mammary fat pad of FBV/N mice, and tumor growth was evaluated by bioluminescence imaging after 4 weeks. Scale bar, 1 cm. Luciferase quantification is shown as photons per second (n = 5). Mean ± s.d. is shown. Asterisks indicate P < 0.01 by Student’s t-test. e Schematic representation of the HSF1–PARP13–PARP1 ternary complex

