Fig. 3.
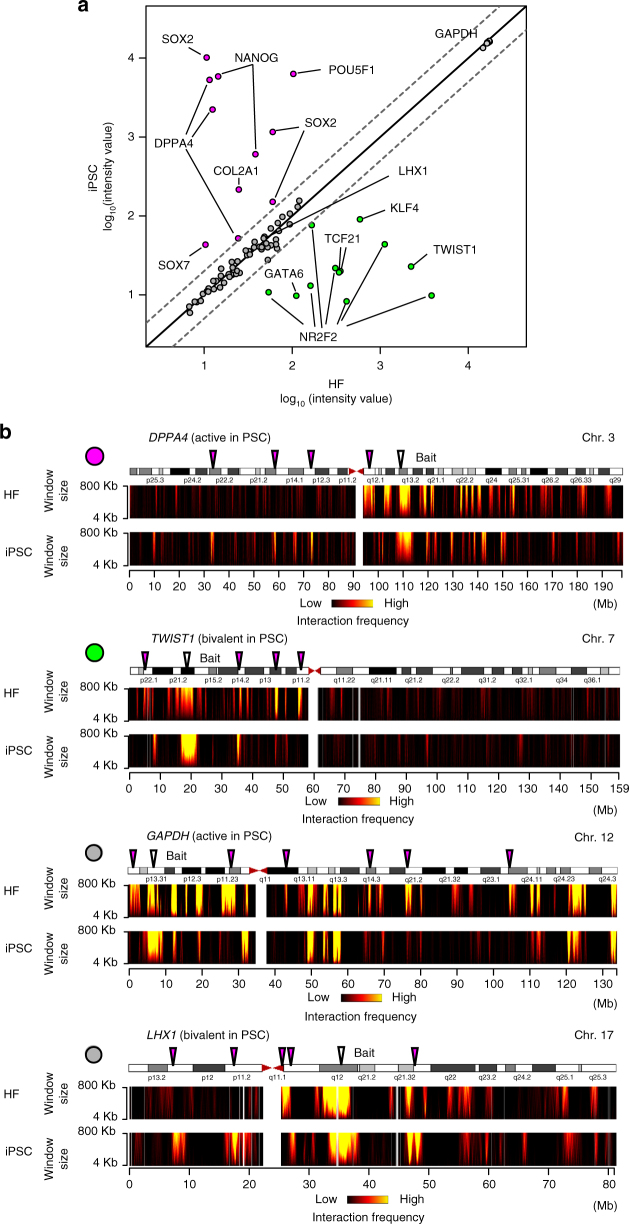
Chromatin interaction profiles at bivalent gene loci in somatic cells and hPSCs. a Expression profiles of bait genes in iPSCs and their original HFs (HDFs). The scatter plot represents the log10 signal intensity of probe sets for Affymetrix GeneChip Array (HG-U133_Plus_2). A single gene is sometimes represented by multiple probe sets corresponding to different isoforms and ESTs derived from the same gene locus. Thus, some genes have multiple dots (probe sets). Two dashed lines indicate the two-fold changes in gene expression levels between HFs (HDFs) and hiPSCs. The dots are color-coded as category 1 (magenta), category 2 (green), and category 3 (gray) on the basis of the fold change of the signal intensity. b Cis-chromosomal interaction profiles of the bait loci (DPPA4, TWIST1, GAPDH, and LHX1). The interaction frequencies of baits are shown by domainograms37. DPPA4 and GAPDH are active genes in PSCs. TWIST1 and LHX1 are bivalent genes in PSCs. The arrowheads indicate bait loci (white) and representative interaction regions that differ between HFs (HDFs) and hiPSCs (magenta). The left upper dots are colored according to the definition in a

