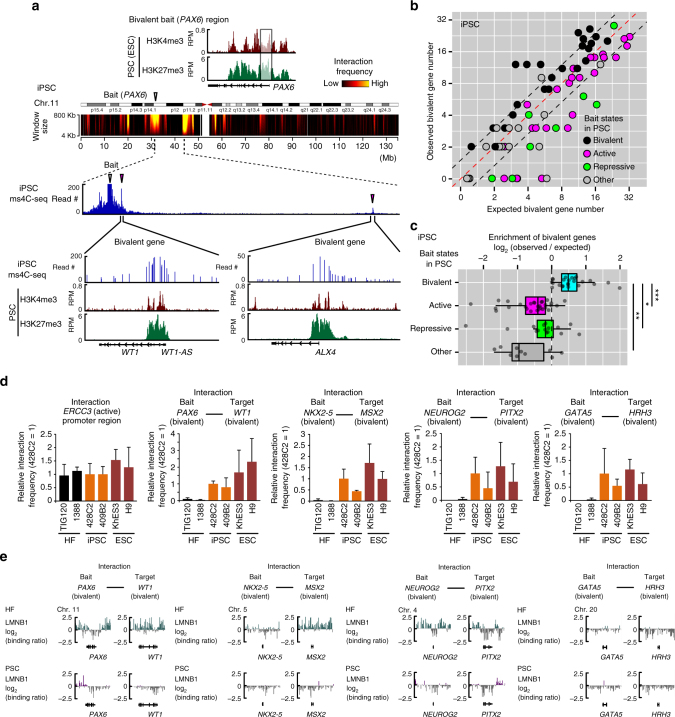
Fig. 5.
Bivalent gene loci colocalize in hPSCs. a The distribution of histone modifications for H3K4me3 and H3K27me3 in the PAX6 bait locus and their target loci. ChIP-seq data are represented by RPM signals for H3K4me3 and H3K27me3 in ESCs below ms4C-seq interaction signals in iPSCs. b Bivalent gene numbers in the interaction target genes of active, repressive, and bivalent bait loci in iPSCs (428C2). The scatter plot shows the expected numbers of bivalent gene (x-axis) and observed numbers of bivalent genes (y-axis) in the interaction targets of each bait locus. The expected number was calculated by the proportion of bivalent genes present on the same chromosome as bait loci. Bait genes were divided into bivalent (black), active (magenta), repressive (green), and other (gray) in PSCs (ESCs) according to Fig. 1b. c The enrichment of bivalent genes in interaction target genes of bivalent bait loci in iPSCs (428C2). Box plots show log2(observed frequency for bivalent genes)/(expected frequency for bivalent genes) in interaction targets of bivalent, active, repressive, and other bait gene loci (U-test, *p < 3 × 10⁻⁵, **p < 1 × 10⁻⁵, and ***p < 1 × 10⁻¹¹). d Interaction frequencies of bivalent gene loci in hESCs (KhES3 and H9), hiPSCs (428C2 and 409B2), and their original HFs (TIG120 and 1388). Bar graphs indicate the interaction frequencies of the indicated gene loci determined by enhanced 3C-qPCR analysis. The interaction frequencies in the ERCC3 promoter region are shown as positive interaction controls. Data are shown as means ± SD from three biological replicates. e Lamina-association profiles of colocalized bivalent gene loci are indicated by log2(Dam-LMNB1/Dam) in HFs and PSCs (ESCs)40, 41. See also Supplementary Figs. 4–6

