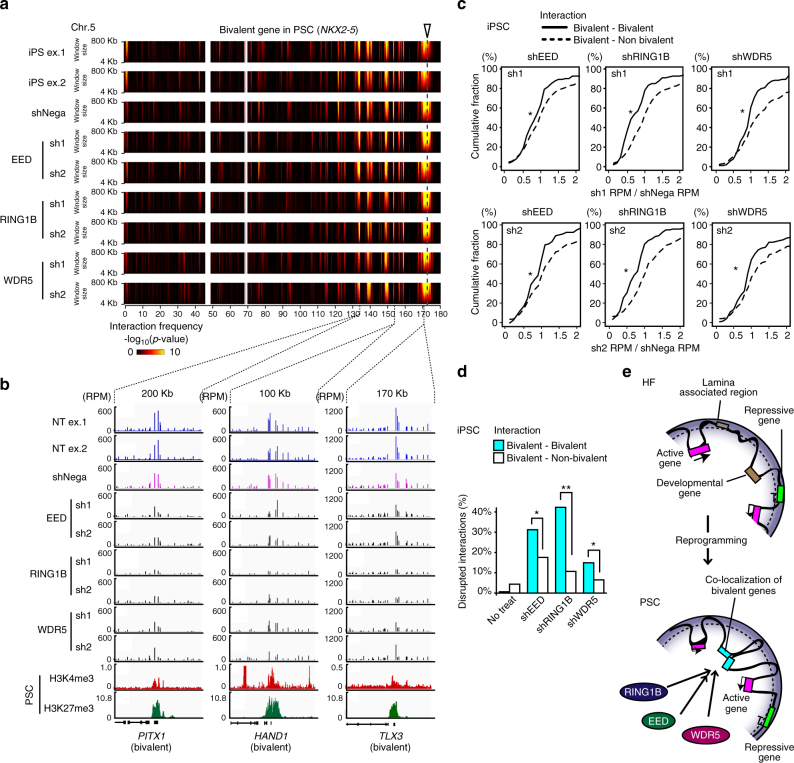
Fig. 6.
EED, WDR4, and RING1B are important for the colocalization of bivalent gene loci. a Interaction profiles determined by ms4C-seq for the NKX2-5 gene locus in EED, WDR5, and RING1B KD iPSCs. Domainograms indicate cis-chromatin interaction frequencies at the NKX2-5 gene locus on an Mb scale in shRNA-treated iPSCs. b The disruption of chromatin interactions between bivalent gene loci by shRNA treatment. Bar plots indicate interaction signals (RPM) at interaction target gene loci of the NKX2-5 gene bait locus. ChIP-seq signals (RPM) for H3K4me3 and H3K27me3 histone modifications in PSCs (ESCs) are shown under the ms4C-seq interaction signals. Reduced interaction signals of the bait NKX2-5 gene locus are detected in bivalent gene loci (PITX1, HAND1, and TLX3) after shRNA treatment against EED, WDR5, or RING1B in PSCs (iPSCs). c Cumulative distribution of reduction rates for interaction signals (RPM values in TSS ± 25 kb) in bivalent–bivalent (solid line) and bivalent–nonbivalent (dashed line) interactions by two independent knockdown (two different shRNAs) experiments for EED, RING1B, or WDR5 in PSCs (iPSCs). *p < 0.03 was assessed for bivalent–bivalent interactions vs. bivalent–nonbivalent interactions by two-sided Mann–Whitney U-test. d Disruption of bivalent gene colocalizations by the KD for EED, WDR5, or RING1B. Bar graphs show the percentages of colocalized bivalent genes (light blue) and nonbivalent genes (white) with interaction signals (RPM values in TSS ± 25 kb) that were reduced to at least 30% following both sh1 and sh2 treatments for EED, WDR5, and RING1B compared to shNegative treatment (Fisher’s exact test, *p < 0.01, **p < 1 × 10⁻⁶). e A model for the changes in chromatin interactions and subnuclear localization around bivalent gene loci during somatic cell reprogramming. See also Supplementary Fig. 7

