
Figure 5.
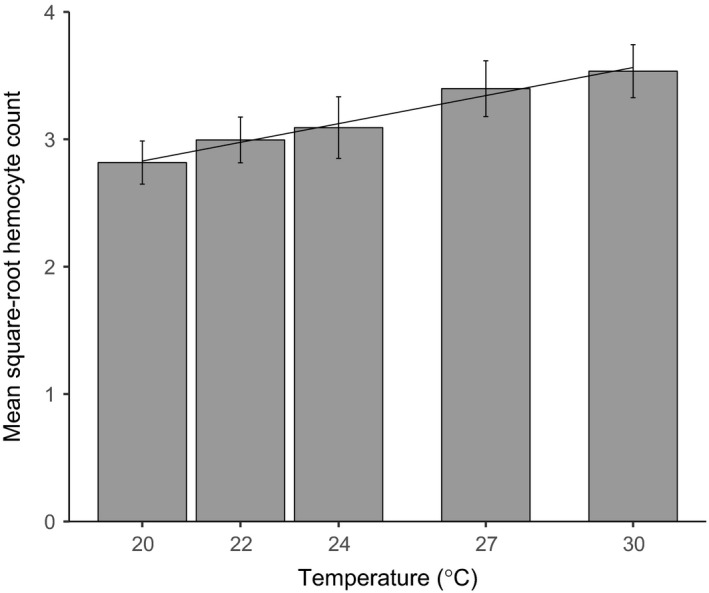
Temperature effects on hemocyte count. The bars show means and 95% confidence intervals for square‐root hemocyte count for each temperature treatment. The fitted line shows the predicted values from the model
Official websites use .gov
A
.gov website belongs to an official
government organization in the United States.
Secure .gov websites use HTTPS
A lock (
) or https:// means you've safely
connected to the .gov website. Share sensitive
information only on official, secure websites.
Temperature effects on hemocyte count. The bars show means and 95% confidence intervals for square‐root hemocyte count for each temperature treatment. The fitted line shows the predicted values from the model