Figure 7.

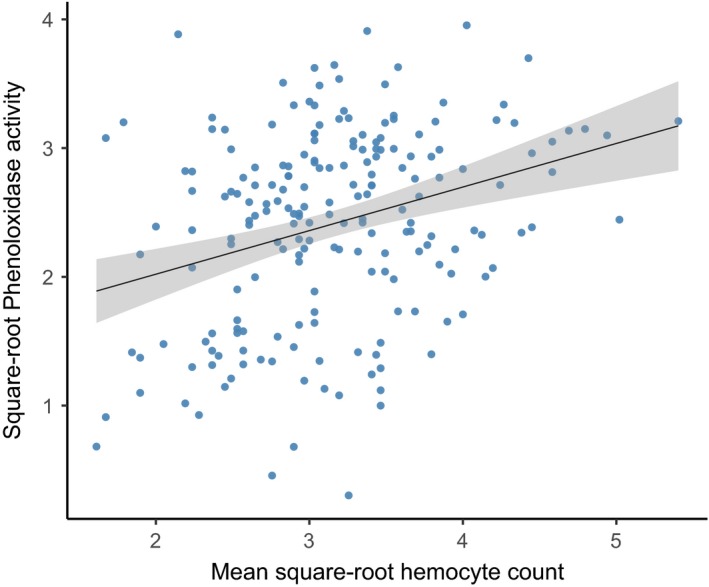
Square‐root PO activity plotted against square‐root hemocyte count. The line is for illustrative purposes only and shows the results of a simple linear regression through the data

Square‐root PO activity plotted against square‐root hemocyte count. The line is for illustrative purposes only and shows the results of a simple linear regression through the data