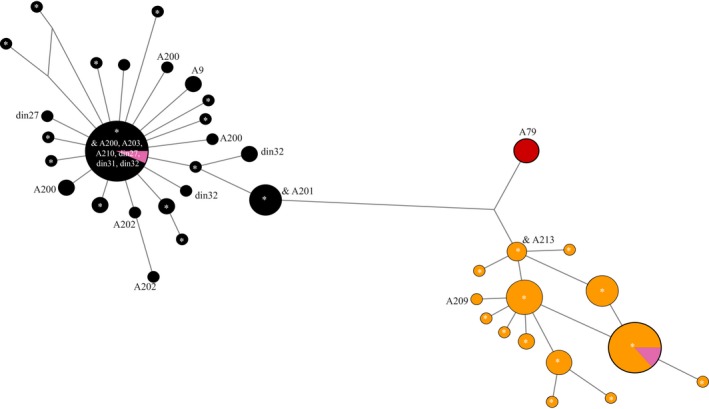
Figure 4.

Median spanning network based upon the mitochondrial diagnostic region (1,706 bp) in 124 dingoes and five NGSD. Black coloration indicates NW lineage haplotypes, orange SE lineage haplotypes, red NGSD haplotypes, and pink captive individuals. Branch lengths are relative to the number of mutations separating mitochondrial haplotypes. Mitochondrial control region haplotypes are shown with A29 depicted as * and less common haplotypes as text
