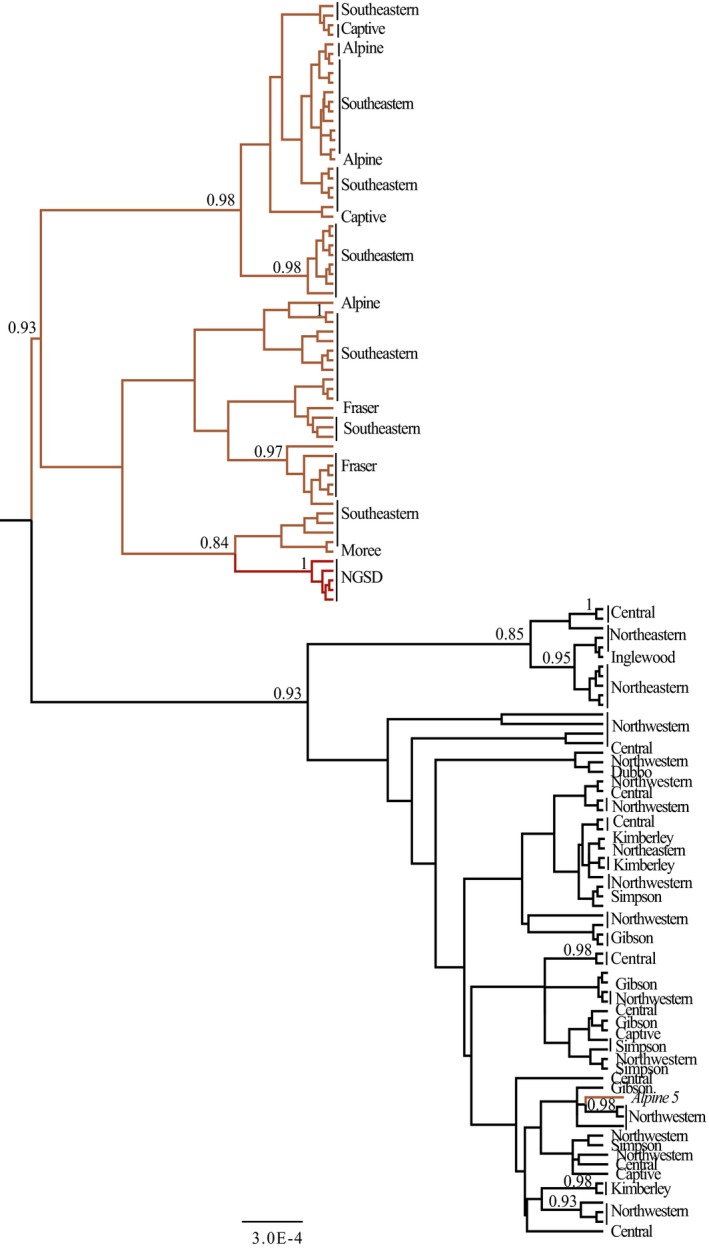
Figure 6.

Bayesian analysis of 124 dingo and five NGSD mitochondrial diagnostic region (1,706 bp) sequences. Analyses constructed in BEAST v1.7.5 (Drummond et al., 2012) using a GTR + G + I substitution model and a constant population size coalescent model. Integers below nodes are posterior probability values and values less than 0.6 are not shown. Colors represent geographical sampling population, black for NW, orange for SE, and red for NGSD. The scale bar indicates an estimate of the average per site substitutions between two nodes
