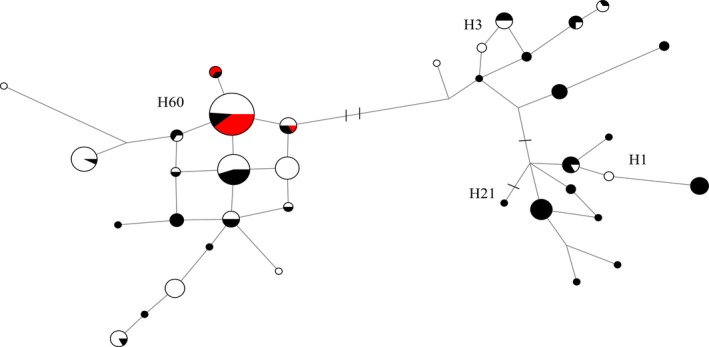
Figure 8.

Median spanning network based upon Y chromosome SNP and STR haplotypes for 173 dingoes and 20 NGSD. Black coloration indicates dingoes from this study, red indicates NGSD individuals, and white indicates dingo samples from Sacks et al. (2013). Strokes across branches indicate the presence of Y chromosome SNP mutations differentiating between Y chromosome haplogroups. Branch lengths are relative to the number of STR mutations between Y chromosome haplotypes
