
Figure 12.
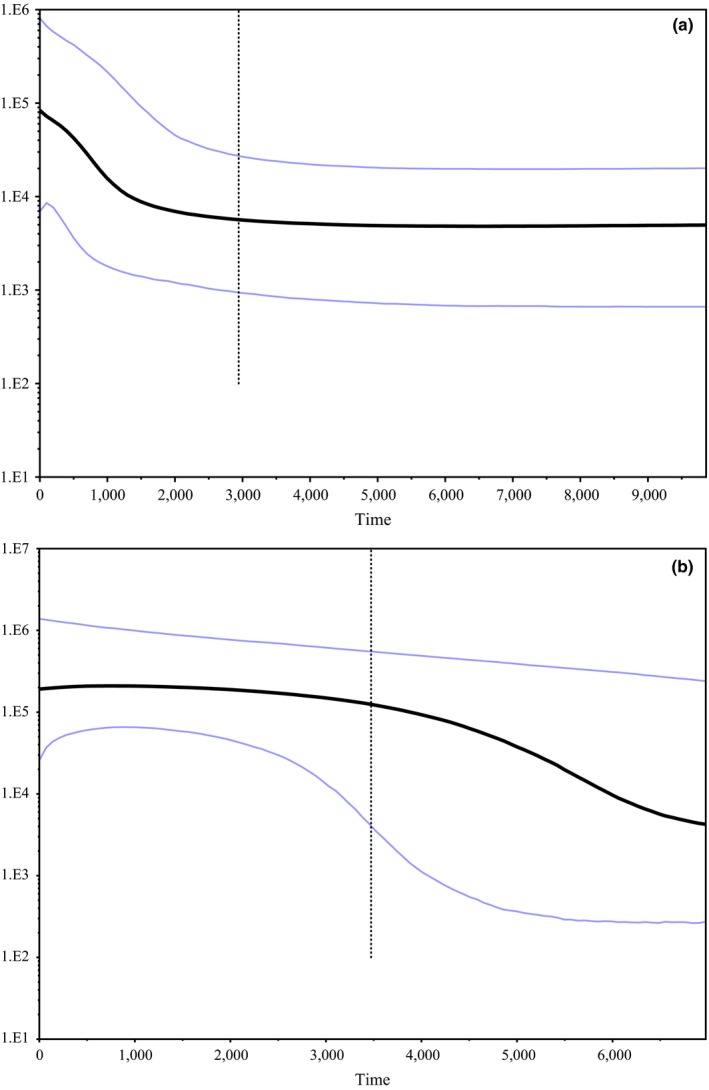
Bayesian skyline plots based on modeling on (a) 57 SE lineage or (b) 67 NW lineage dingoes using mitochondrial diagnostic region (1,706 bp) sequences. Analyses constructed using a GTR + G + I substitution model and a skyline coalescent model in BEAST v1.7.5 (Drummond et al., 2012). A strict clock was enforced with a substitution rate of 7.7027 × 10⁻⁸ mutations−1 site−1 year−1 with a standard deviation of 5.4848 × 10⁻⁹. The skyline plots were constructed in Tracer 1.5 (Rambaut & Drummond, 2007)