
Figure 3.
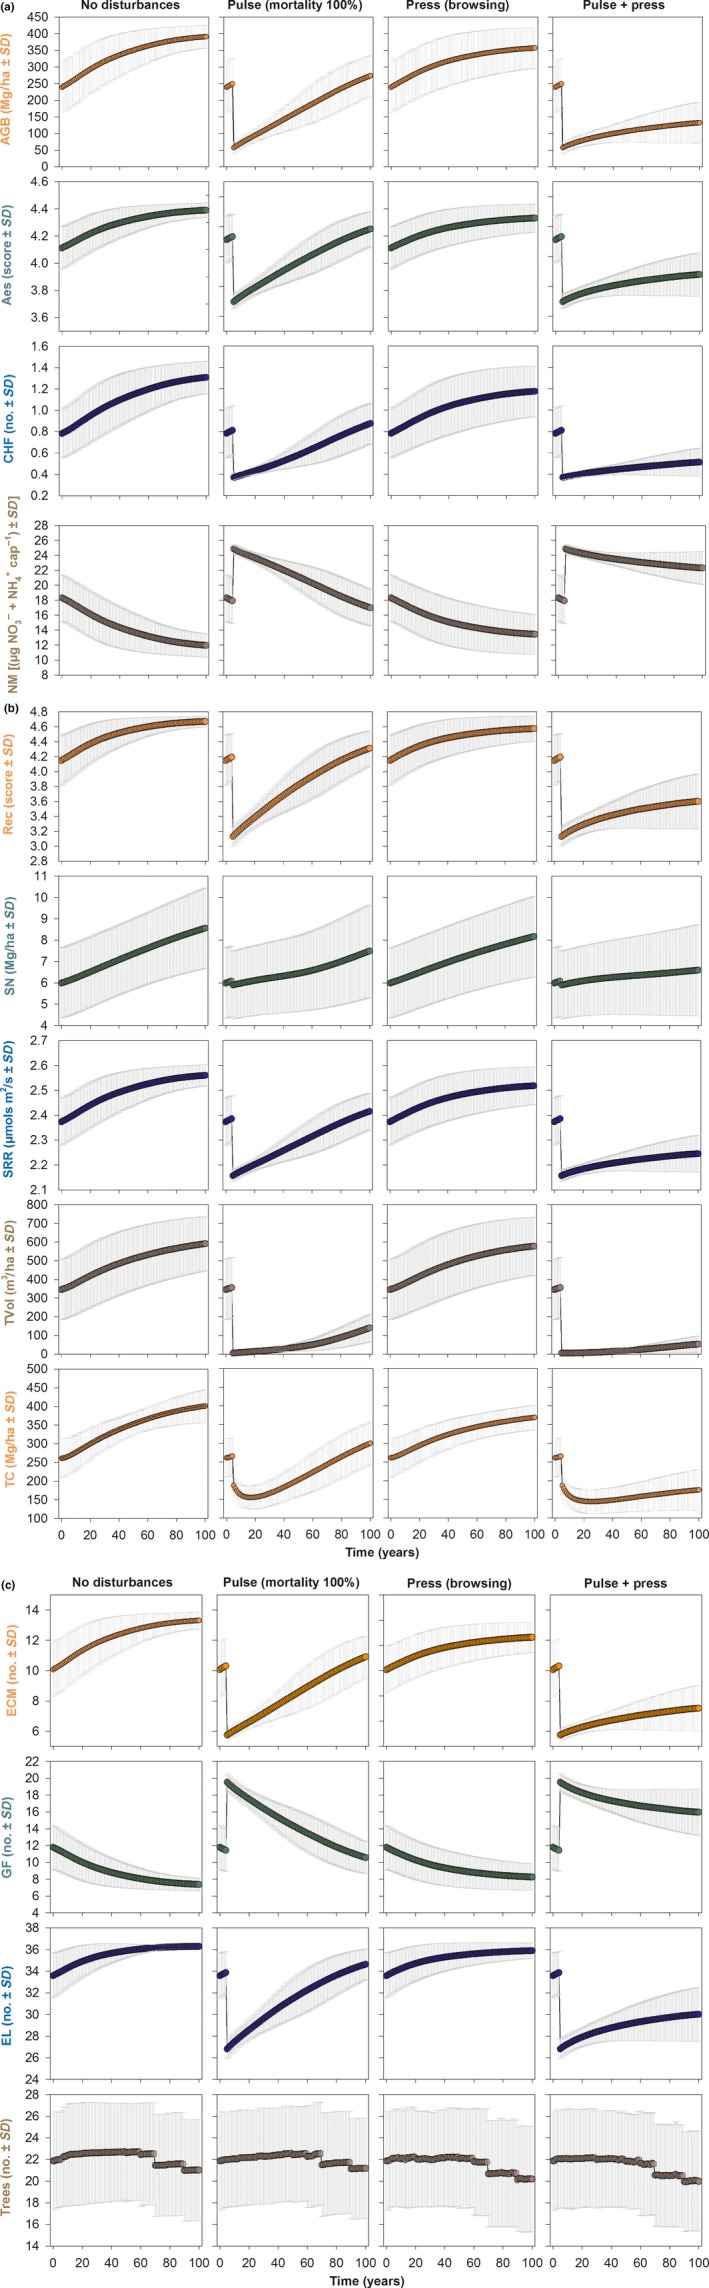
Ecosystem services and biodiversity measures of different degrees of disturbance simulated by pulse and pulse+press set scenarios over a 100‐year time span. Values represent landscape level means weighted by ecoregions (in color) and standard deviations (in gray) across three replicates. (a) Aes, aesthetic value; CHF, commercially harvested fungi richness; NM net N mineralization; (b) Rec, recreation value; SN, soil nitrogen stock; SRR, soil respiration rate; TVol, timber volume; TC, total carbon stock; (c) ECM, ectomycorrhizal fungi richness; GF, ground flora richness; EL, epiphytic lichen richness; and Trees, tree species richness. Note that for illustrative purposes, only four of the 12 scenarios are presented here. The first two columns illustrate the least and the most severe of the pulse set scenarios (0% and 100% pulse disturbance), whereas the last two columns illustrate the least and the most severe of the pulse + press scenarios (press only and 100% pulse disturbance combined with press). See text for a full description of the scenarios