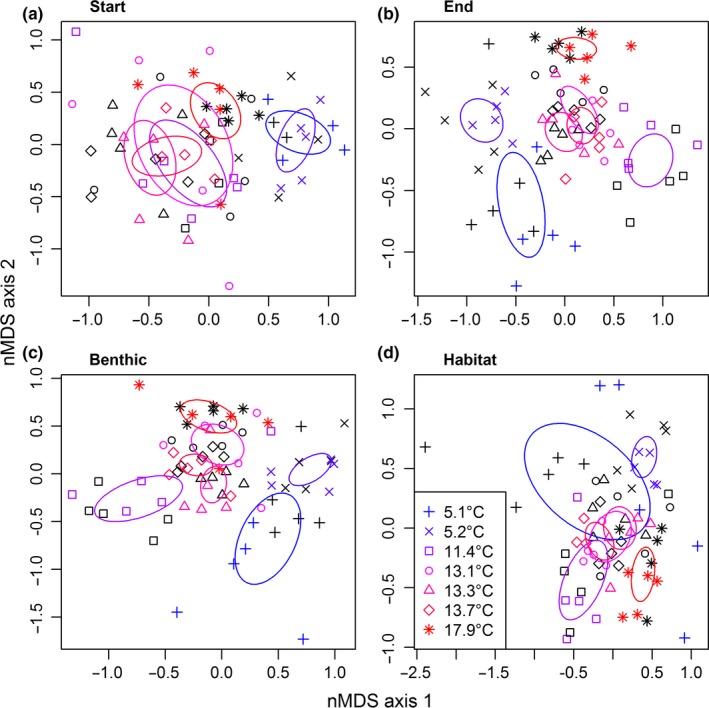
Figure 4.

Similarity in macroinvertebrate community composition between sites (a) at the start, (b) at the end, (c) comparing only the benthic samples at the end, and (d) comparing only the artificial plants with benthic samples within habitat treatment plots at the end of the experiment. Black and colored symbols correspond to the control and habitat complexity treatments, respectively. The ellipses are the standard error of the weighted average of point scores within each stream
