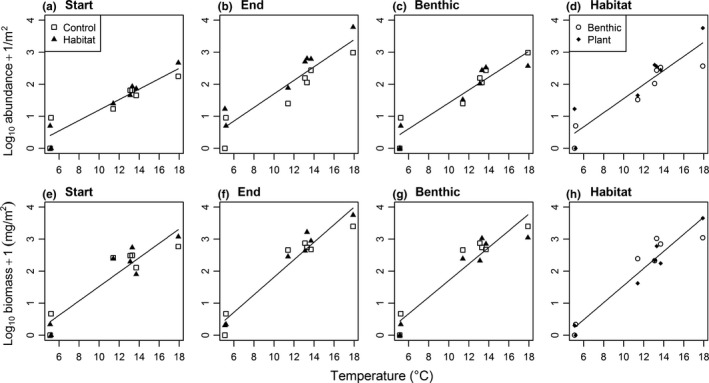
Figure 6.

Relationships between temperature and average total (a–d) abundance and (e–h) biomass of Radix balthica at the start, at the end, comparing only the benthic samples at the end (benthic), and comparing only the artificial plants with benthic samples within habitat treatment plots at the end of the experiment (habitat). The line of best fit for the significant main effect of temperature is shown in each case: (a) not significant; (b) y = 1.075 − 0.075x, r 2 = 0.73; (c) y = 0.881 − 0.061x, r 2 = 0.73; (d) y = 0.873 − 0.061x, r 2 = 0.78; (e) y = −0.722 + 0.224x, r 2 = 0.86; (f) y = −0.925 + 0.274x, r 2 = 0.93; (g) y = −0.881 + 0.259x, r 2 = 0.89; (h) y = −1.118 + 0.267x, r 2 = 0.92
