
Figure 4.
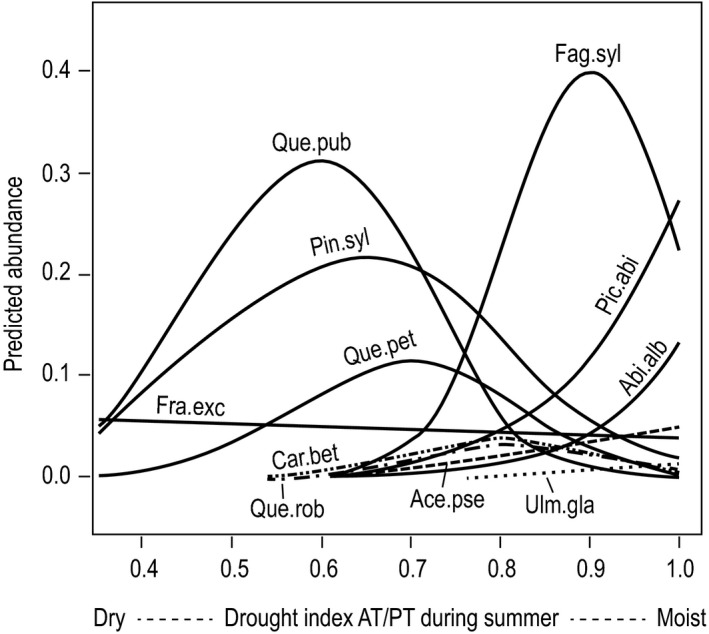
Species sensitivity to drought. Response curves were derived from single variable GLMs with cover abundance of mature trees as the response variable and a drought index (mean AT/PT between June and August, 1981–2010) as predictor based on data from 1,075 study plots across Switzerland. The different species abundance maxima reflect the different mean abundance that species reached on the study plots (Table 1). Prunus avium is not illustrated because its response curve runs horizontally at a level of about 0% abundance. If modeled AT/PT is smaller than about 0.3–0.4, forests are not able to persist due to excessive water shortage