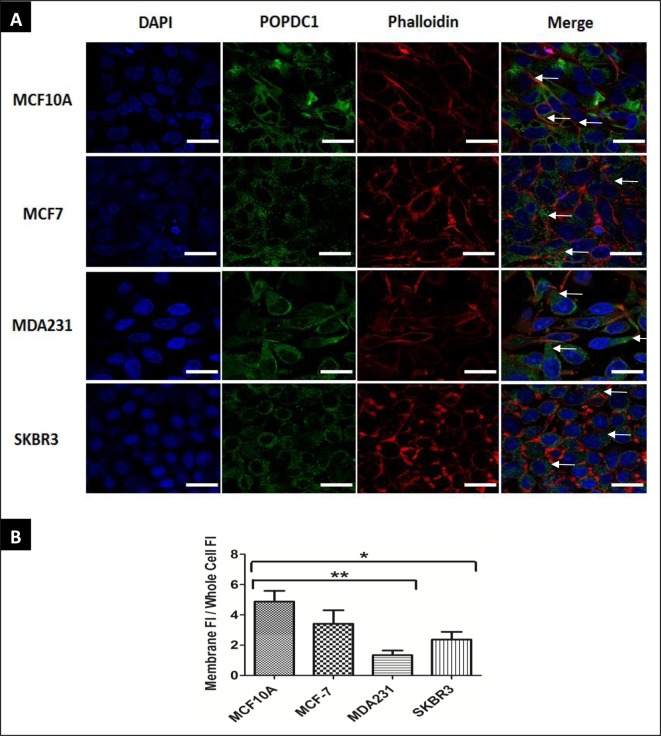
Figure 2. POPDC1 membrane localization is reduced in cancer cells.
(A) Cell membrane expression of POPDC1 is reduced in breast cancer cell lines. Immunocytochemical analysis of cell membrane expression of POPDC1 in breast cancer cells. Cells were counterstained with CF-555 Phalloidin (red) for visualization of filamentous actin on the cytoskeleton and nuclear probe DAPI (blue). In MCF10A non-malignant cells, regions of high POPDC1 (green) localization on the plasma membrane (white arrows) are observed. Plasma membrane expression of POPDC1 is reduced in MDA231 and SKBR3 cells (white arrows indicate POPDC1 located in other cellular locations in these images); scale bars = 20 µm. (B) Quantitative analysis of the membrane expression of POPDC1 in different cell lines. Membrane POPDC1 fluorescence intensity per μm2 was measured for individual cells along with fluorescence intensity per μm2 across the whole cell. This was then converted to a ratio of fluorescence intensity in the membrane/fluorescence intensity across the entire cell. Membrane expression of POPDC1 is significantly reduced in MDA231 and SKBR3 cells compared with non-malignant MCF10A cells (n=4). Comparisons were conducted using ANOVA with Dunnett’s; *P≤0.05, **P≤0.01.Data are presented as mean ratio ± SEM.

