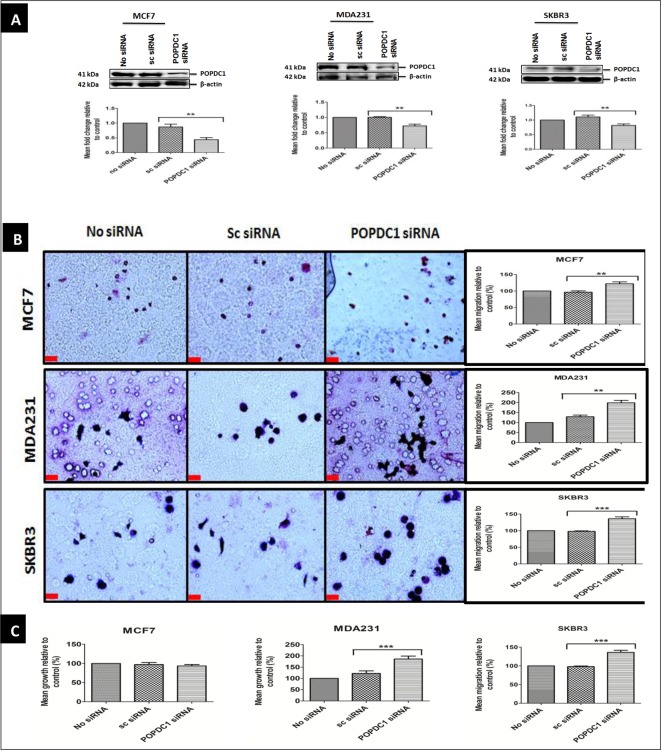
Figure 3. Suppression of POPDC1 promotes cell migration and proliferation in breast cancer cells.
(A) Western blot analysis of POPDC1 expression following transfection with POPDC1 siRNA confirmed POPDC1 suppression in MCF7 (n=3), MDA231 (n=3) and SKBR3 (n=3) cells. Graphs below image panels represent densitometric quantification of protein bands. Protein bands were normalized by calculating the POPDC1/β-actin ratio. Normalized ratios were subsequently expressed as a ratio relative to control bands (no siRNA) to determine protein fold changes. (B) Suppression of POPDC1 with POPDC1 siRNA significantly promoted cell migration in MCF7 (n=5), MDA231 cells (n=5) and SKBR3 cells (n=5). Boyden chamber assay was performed over a 3-h incubation period to allow cell migration across the polycarbonate membrane; scale bars = 250 μm. (C) Suppression of POPDC1 with POPDC1 siRNA significantly promoted cell proliferation in MDA231 cells (n=5) and SKBR3 cells (n=5), but not in MCF7 cells (n=4). Cells were transfected for 36 h prior to overnight starvation in serum-free medium and subsequent incubation in 10% AlamarBlue® dye for 4 h. Comparisons of protein fold change ratios, mean % migration and mean % proliferation were conducted using ANOVA with Dunnett’s post hoc test. Mean values presented ± SEM; **P≤0.01, ***P≤0.001.

