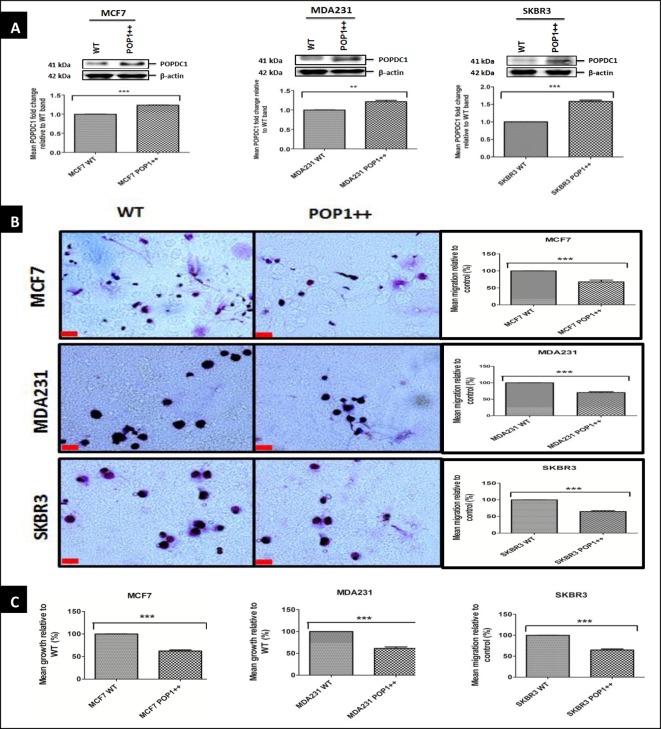
Figure 4. Overexpression of POPDC1 suppresses breast cancer cell migration and proliferation.
(A) Western blot analysis of POPDC1 expression in wild-type cells and cell lines stably transfected with POPDC1; MCF7 POP1++, MDA231 POP1++ and SKBR3 POP1++. Stably transfected cell lines expressed significantly higher levels of POPDC1 MCF7 (n=4), MDA231 (n=4) and SKBR3 (n=4). Graphs below Western blot band panels represent densitometric quantification of protein bands. Protein bands were normalized by calculating the POPDC1/β-actin ratio. Fold differences in protein expression were calculated by expressing normalized band values of POPDC1 overexpressing cell lines as a ratio to normalized band values of wild-type cell lines. (B) Overexpression of POPDC1 significantly suppressed cell migration in MCF7 cells (n=4), MDA231 (n=5) and SKBR3 cells (n=5). Boyden chamber assay was performed over a 3-h incubation period to allow cell migration across the polycarbonate membrane; scale bars = 250 μm. (C) Overexpression of POPDC1 significantly suppressed cell proliferation in MCF7 cells (n=4), MDA231 cells (n=5) and SKBR3 cells (n=5). Cells were starved in serum-free medium overnight prior to incubation in 10% AlamarBlue® dye for 4 h. Comparisons of protein fold change ratios, mean % migration and mean % proliferation were conducted using an unpaired t-test. Mean values presented ± SEM; **P≤0.01, ***P≤0.001.

