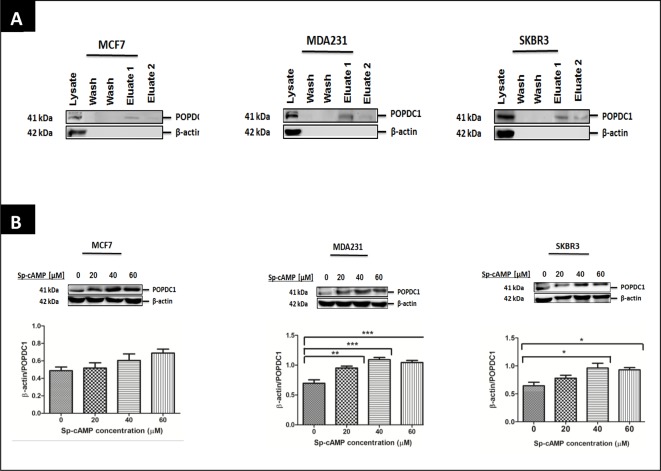
Figure 5. cAMP interacts with POPDC1 and up-regulates its expression in breast cancer cells.
(A) Western blot analyses of cAMP agarose pull-down assays in MCF7, MDA231 and SKBR3 cells. POPDC1 was detected at high levels in the first eluted fraction (eluate 1) and at very low levels in the second eluted fraction (eluate 2) in MCF7 (n=3), MDA231 (n=3) and SKBR3 (n=3) cells confirming protein interaction between POPDC1 and cAMP. β-Actin, the negative control, was detected in the unbound protein fraction but not in the eluted fractions, confirming specificity of the assay. (B) Western blot analysis of the effects of 20, 40 and 60 µM Sp-8-Br-cAMPS on the expression of POPDC1 and CREB following 1 h treatment duration in MCF7 (n=3), MDA231 (n=3) and SKBR3 (n=3) cells. Graphs below Western blot band panels represent densitometric quantification of POPDC1 bands as a ratio to corresponding β-actin bands. Comparisons of normalized β-actin/POPDC1 ratios were conducted using ANOVA with Dunnett’s post hoc test. Mean values presented ± SEM; *P≤0.05, **P≤0.01, ***P≤0.001.

