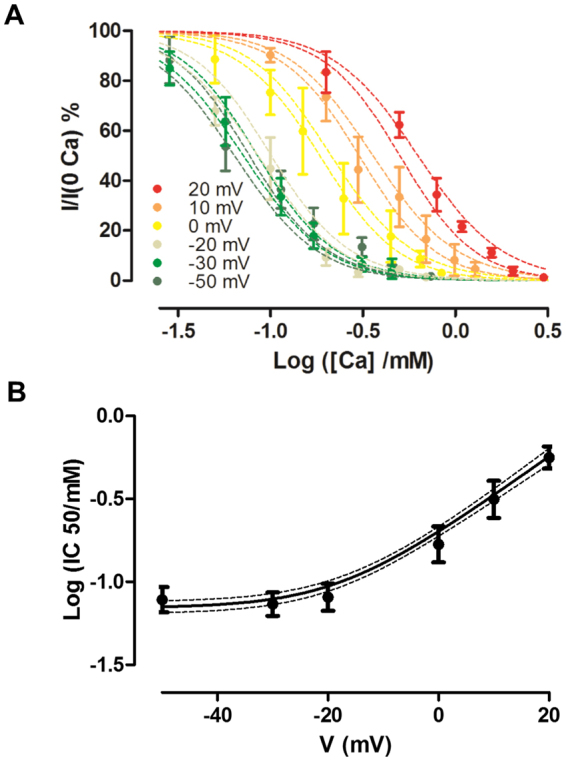
Figure 3.

Stabilization of the closed state reproduces the observed changes in inhibition. (A) Ca2+ inhibition data at different voltages was fitted using the linear Hill model. The discontinuous lines show the 95% confidence intervals of the model for the inhibition curves obtained at different voltages. (B) The points show the Log IC50 determined at different voltages. The black line indicates the prediction of the Log IC50 according to the linear Hill model, and the dotted lines show the 95% confidence intervals.
