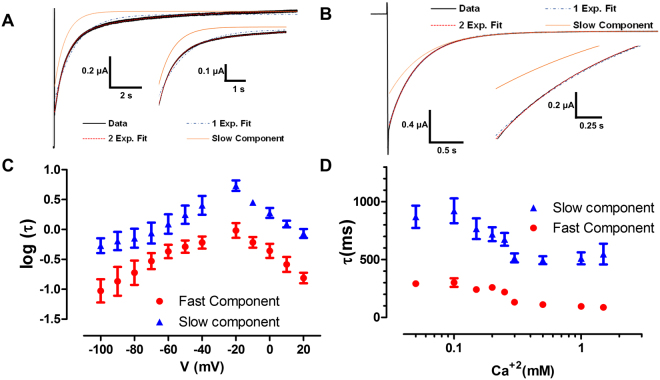
Figure 4.
Current relaxation of Cx46 shows two-time constants. (A) Activation kinetics seen after a voltage pulse to 0 mV from a holding of −40 mV shows a current that is well fitted by a sum of two exponentials. (B) The same is observed in deactivation kinetics when a pulse to −80 mV is given from a holding of 0 mV. The insets an A and B show a magnification of the activation and deactivation current trace to better appreciate the difference between fitting one or two exponentials, this difference is statistically significant. (C) At nominal Ca2+ concentration, the time constants present intrinsic voltage dependence. As can be seen in (D), Ca2+ accelerates the time constants until they reach saturation at high Ca2+ concentrations (at −100 mV).

