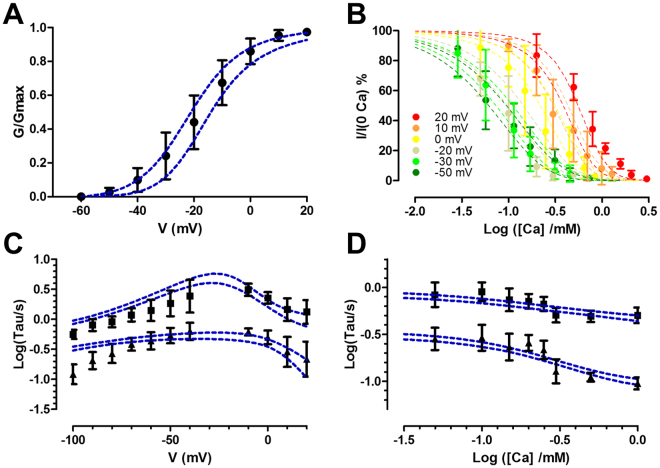
Figure 6.
Global fit of the data to the allosteric model with 6 Ca2+ binding sites. (A) G/Gmax vs voltage. (B) Ca2+ inhibition curves at different voltages. (C) Time constants vs voltage from activation and deactivation kinetics. (D) Time constants vs Ca2+ concentration from deactivation kinetics at −100 mV. Data is presented as mean ± SD. The lines of the fitting indicate the 95% confidence bands. To display the fitting, we draw 400 sets of parameters from the posterior distribution and the experimental results were simulated based on the proposed model with each parameter set.

