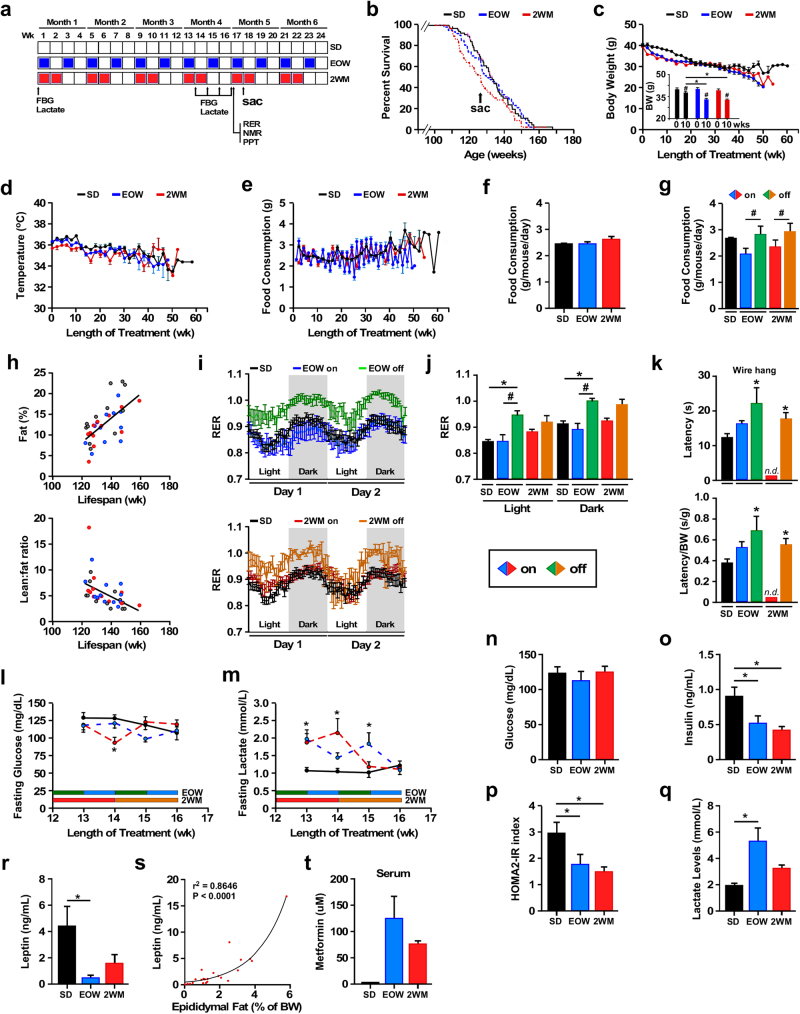
Fig. 1.
Characteristics of mice on intermittent metformin treatment. a Protocol design. Male mice (108 week-old) were fed a standard diet (SD) without (n = 68) or with 1% metformin in the diet every-other week (EOW, n = 64) or for two consecutive weeks each month (2WM, n = 67) for 24 weeks. At the indicated time points (weeks), body composition (NMR), metabolic assessment (RER), and physical performance tests (PPT) were performed on non-fasted animals, whereas blood glucose and lactate levels were measured in 6-h fasted mice. Sac, sacrifice of a subset of animals for tissue collection and analysis (SD, n = 10; EOW, n = 6; 2WM, n = 6). b Kaplan–Meier survival curve for the three experimental groups of mice (SD, EOW, 2WM). No extension of maximal lifespan was observed. c Body weight profile over the lifespan. Data include all live animals at each time point. Inset, Body weight at the initiation (0) and after 10 weeks of treatment (10) (SD, n = 68(0) and 64(10); EOW, n = 64(0) and 58(10); 2WM, n = 67(0) and 57(10)). #p < 0.05 compared to t = 0; *p < 0.05 compared to SD at t = 10 weeks. d Body temperature. e Food consumption. f Average daily food consumption per mouse. g The data shown in panel f was segregated by whether mice were on metformin treatment or returned to SD without metformin. h Correlations between % body fat (upper panel) or lean-to-fat ratio (lower panel) and time of death (n = 12 in each group) (upper, F = 22.27; dFn, dFd (1, 35); P < 0.0001); lower, (F = 11.1; dFn, dFd (1, 35); P < 0.002). i–j Mice were subjected to metabolic assessment after 17 weeks of treatment (SD, n = 11; EOW on metformin, n = 6; EOW off metformin, n = 6; 2WM on metformin, n = 9; 2WM off metformin, n = 3): i Respiratory exchange ratio (RER) values over the course of 48 h; j RER values shown in panel i were segregated based on the light and dark periods of the L12:D12 cycle; k Latency to fall from wire hang was measured after 16 weeks of treatment (SD, n = 47; EOW on metformin, n = 12; EOW off metformin, n = 7; 2WM on metformin, n = 0; 2WM off metformin, n = 22) before (upper panel) and after (lower panel) correction for body weight. l, m At 13–16 weeks of treatment, mice were fasted for 6 h (SD, n = 8–10; EOW, n = 9–10; 2WM, n = 9–10) and circulating levels of l glucose and m lactate were measured. n–r The following analyses were carried out at 17 weeks of treatment in fed mice (SD, n = 10; EOW, n = 6; 2WM, n = 6): n blood glucose; o serum insulin levels; p HOMA-IR index; q blood lactate; r Serum levels of leptin. s Correlation between circulating levels of leptin and amount of epididymal fat as percent body weight. t Serum levels of metformin after 17 weeks of treatment (SD, n = 3; EOW, n = 6; 2WM, n = 6). Data are represented as the mean ± s.e.m. *P < 0.05 compared to SD-fed mice, #P < 0.05 compared to mice on metformin (Kruskal–Wallis with Dunn’s post hoc test)

