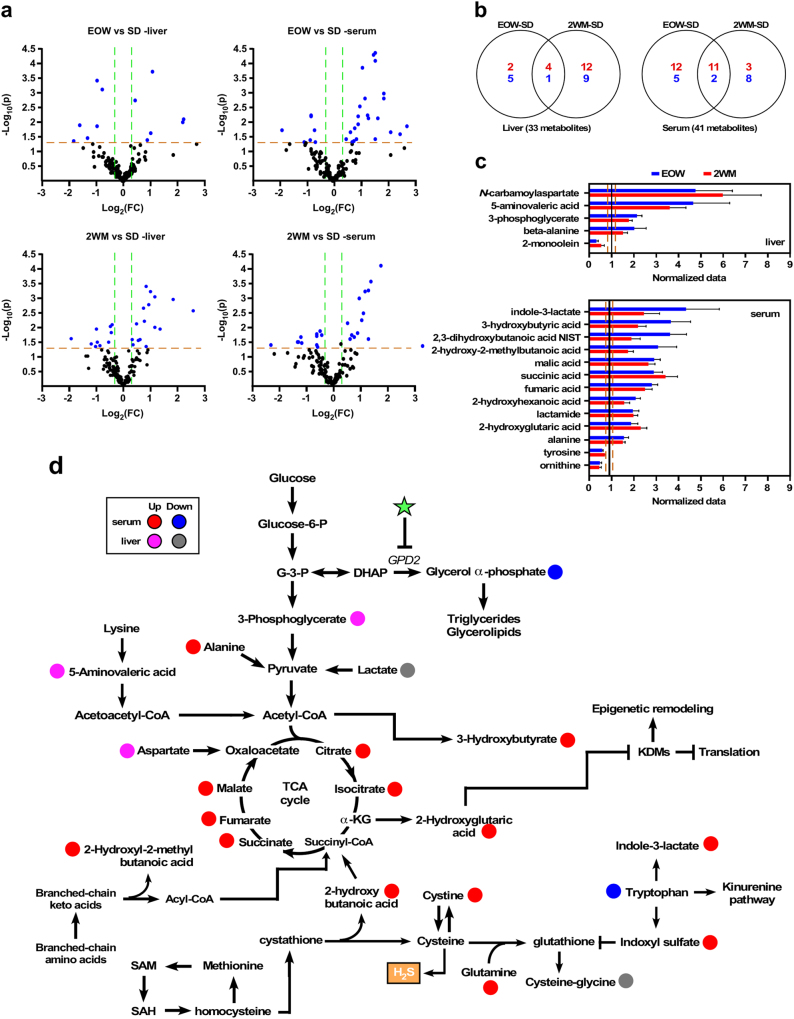
Fig. 4.
Identification of hepatic and serum metabolites in SD-fed mice subjected to intermittent metformin treatment. a Volcano plots of 136 metabolites quantified in the liver and serum of 108-week-old mice maintained for 17 weeks on EOW or 2WM (Liver: SD, n = 10; EOW, n = 5; 2WM, n = 6; serum: SD, n = 10; EOW, n = 6; 2WM, n = 6). Significantly altered metabolites are labeled in blue (fold change ≥ 1.25 in both directions, P ≤ 0.05). b Venn diagrams of upregulated (red) and downregulated (blue) metabolites in the livers (left panel) and serum (right panel) of mice following EOW–SD and 2WM–SD pairwise comparisons. c Graphical representation of the significant metabolites shared by EOW (plotted in blue) and 2WM (plotted in red) normalized to SD controls in the liver (upper) and serum (bottom). See Supplementary Tables S6a and S6b for complete list of significantly altered metabolites. Data are represented as the mean ± s.e.m. d Schematic diagram of select metabolic pathways induced by EOW treatment based on the liver and serum metabolite profiles. Metabolism of organic sulfur compounds is also depicted. Red and pink colors represent increased metabolites and blue and gray colors represent decreased metabolites in serum and liver, respectively. H2S, production of hydrogen sulfide measured in Supplementary Fig. S1g. Data are represented as the mean ± s.e.m; n = 6 biological replicates per group, 23–24 months of age, 17–18 months on diet

