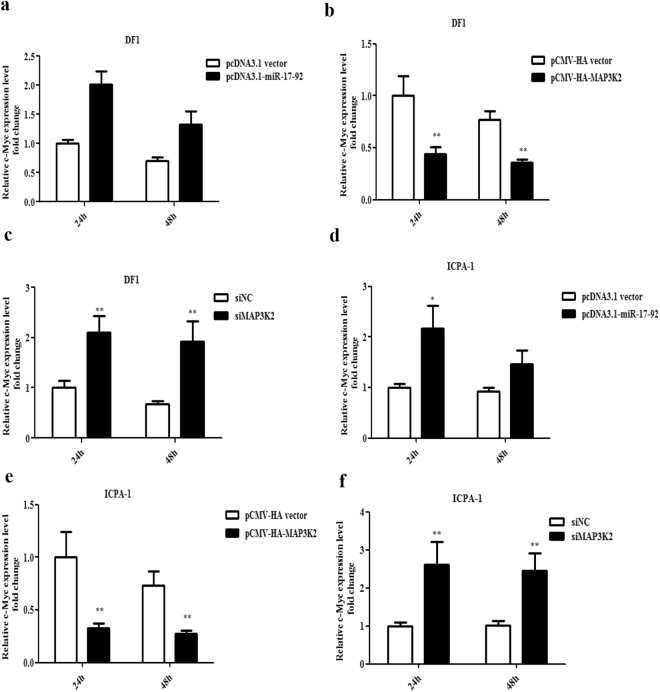
Figure 8.
Effects of overexpression of miR-17-92 cluster and MAP3K2 and knockdown of MAP3K2 on c-Myc expression in DF1 and ICPA-1 cells. DF1 cells (a–c) and ICPA-1 cells (d–f) were transfected with the designated plasmids or siRNAs; at 24 and 48 h after transfection, total RNA was isolated, and c-Myc expression was detected using qRT-PCR. Gene expression was normalized to NONO mRNA level. Fold change is relative to either pcDNA3.1 vector, pCMV-HA vector or siNC at 24 h after transfection. All data are representative of three independent experiments and shown as the mean ± SEM. *p < 0.05; **p < 0.01; determined by two-tailed Student’s t-test.

