Figure 3.
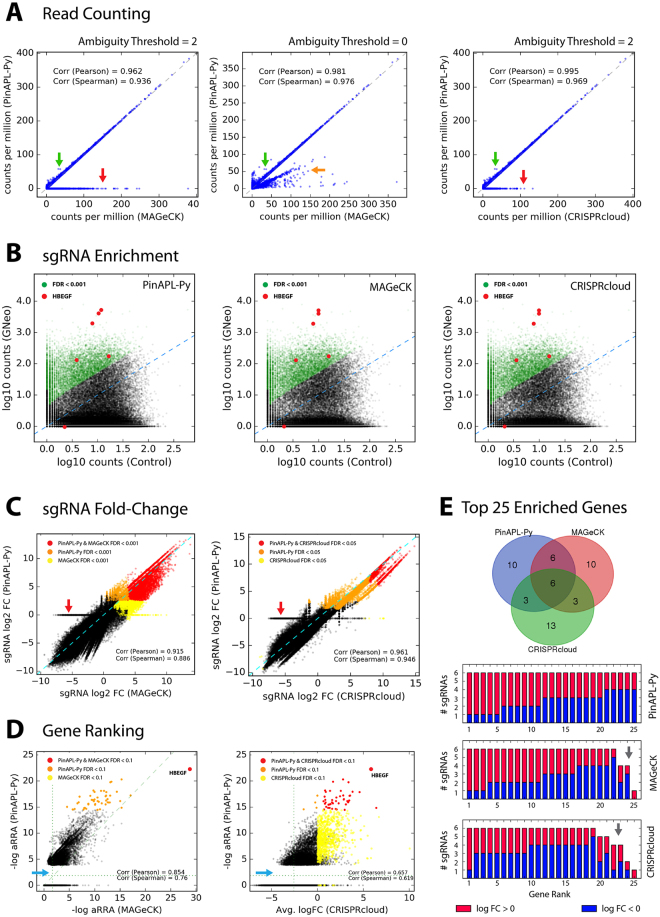
Comparison to other tools. (A) Read counts for each sgRNA obtained by PinAPL-Py (y-axis) and MAGeCK (x-axis, left and middle panel) or CRISPRcloud (x-axis, right panel). The horizontal line of points at y = 0 (red arrows) reflects PinAPL-Py’s rejection of ambiguous reads that map equally well to multiple library entries (see Fig. 2). When reducing the ambiguity threshold to 0, the horizontal line disappears as reads become randomly assigned to one of its matching library entries (middle panel, orange arrow). sgRNAs yielding higher counts in PinAPL-Py (green arrow) are due to failed alignments in MAGeCK/CRISPRcloud caused by indel frameshifts 5′ of the sgRNA sequence. (B) Scatterplots showing log10 (normalized) read counts for each sgRNA from the treatment sample (y-axis) versus control samples average (x-axis) (Left: PinAPL-Py, middle: MAGeCK, right: CRISPcloud). sgRNAs yielding significant enrichment marked in green. sgRNAs targeting HBEGF shown in red. (C) log2 fold-changes (treatment relative to control average) for each sgRNA, compared between PinAPL-Py and MAGeCK (left) and PinAPL-Py and CRISPRcloud (right). sgRNAs yielding significant enrichment in both (red) or either (orange or yellow) method are indicated. The horizontal line of points at y = 0 (red arrows) is a consequence of PinAPL-Py’s rejection of ambiguous reads (see A). (D) Gene ranking scores, compared between PinAPL-Py (αRRA) and MAGeCK (αRRA) (left), and PinAPL-Py (αRRA) and CRISPRcloud (average log2 fold-change). Genes yielding significant enrichment in both (red) or either (orange or yellow) method are indicated. The point gap on the low end of PinAPL-Py’s score range (blue arrows) is caused by its procedure to assign an αRRA score of 1.0 to genes with no significant sgRNAs (E) Venn diagram of the top 25 genes, obtained by each method. Barplots below show the number of sgRNAs for each of the top 25 genes, marked red for enrichment (sgRNA log2 fold-change > 0) and blue for depletion (sgRNA log2 fold-change < 0). The grey arrow points at genes being represented by fewer than 6 sgRNAs in the library. Ideally, genes ranking high for enrichment should be represented only by enriched sgRNAs (red fractions).

