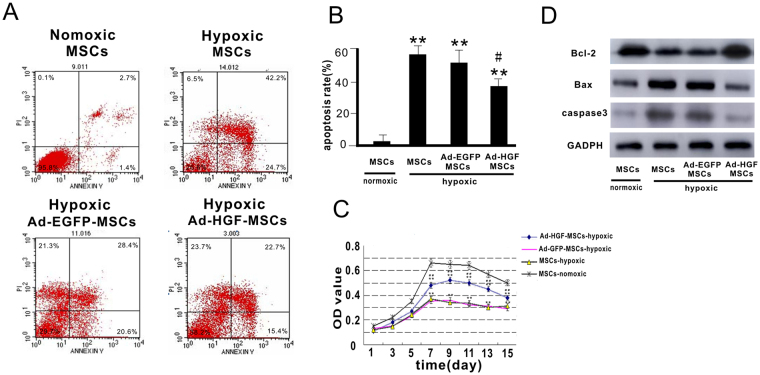
Figure 1.
Infection of HGF into MSCs and the effect on MSC growth and apoptosis after. 12 hours of hypoxia. (A) Flow cytometry analysis of Annexin V/PI was carried out in MSCs. (B) Apoptosis rate was calculated according to Annexin V/PI flow cytometry analysis. (C) MTT curve of MSCs infected with Ad-HGF or vector in normoxic or hypoxic conditions. (D) Representative Western blot and level of Bcl-2, Bax and caspase-3. Data are mean ± SEM. **P < 0.01 vs. MSCs-normoxic, # P < 0.5, ## P < 0.1 vs. Ad-EGFP-MSCs-hypoxic. n = 3, One-way ANOVA, then followed by post-hoc Tukey’s test for multiple comparisons.

