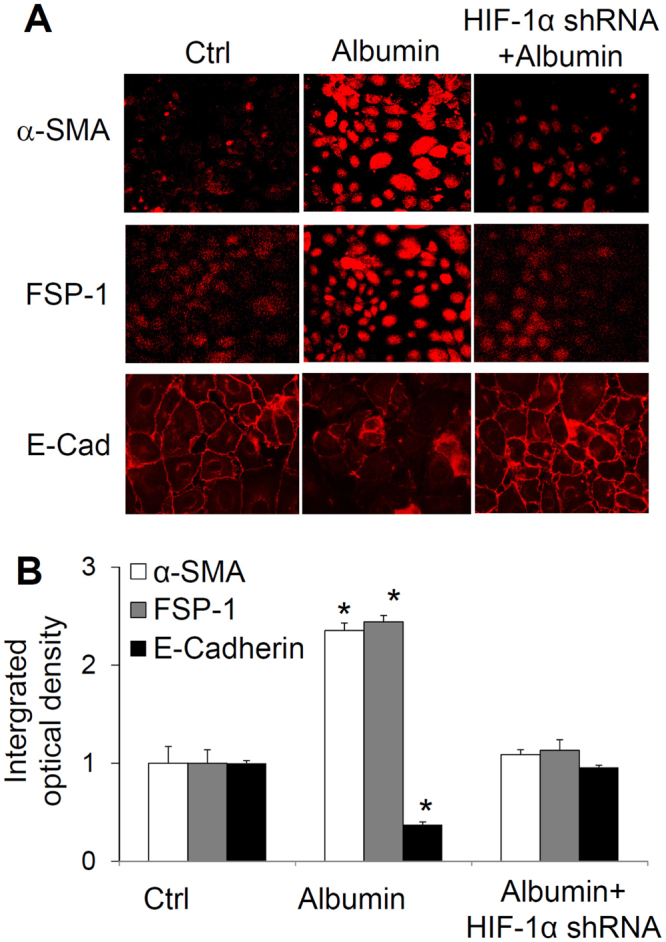
Figure 3.

Effect of HIF-1α shRNA on albumin-induced changes in the immunostaining of α-SMA, FSP-1 and E-cadherin. Upper panel: Representative confocal images showing the immunostaining of α-SMA, FSP-1 and E-cadherin. Lower panel: Summarized integrated optical intensity of the fluorescent staining. Ctrl, cells treated with control plasmids. Albumin, cells treated with albumin + control plasmids. Albumin + HIF-1α shRNA, cells treated with albumin + plasmids expressing HIF-1α shRNA. n = 6 batches of cells, *P < 0.05 vs. other groups.
