
Figure 4.
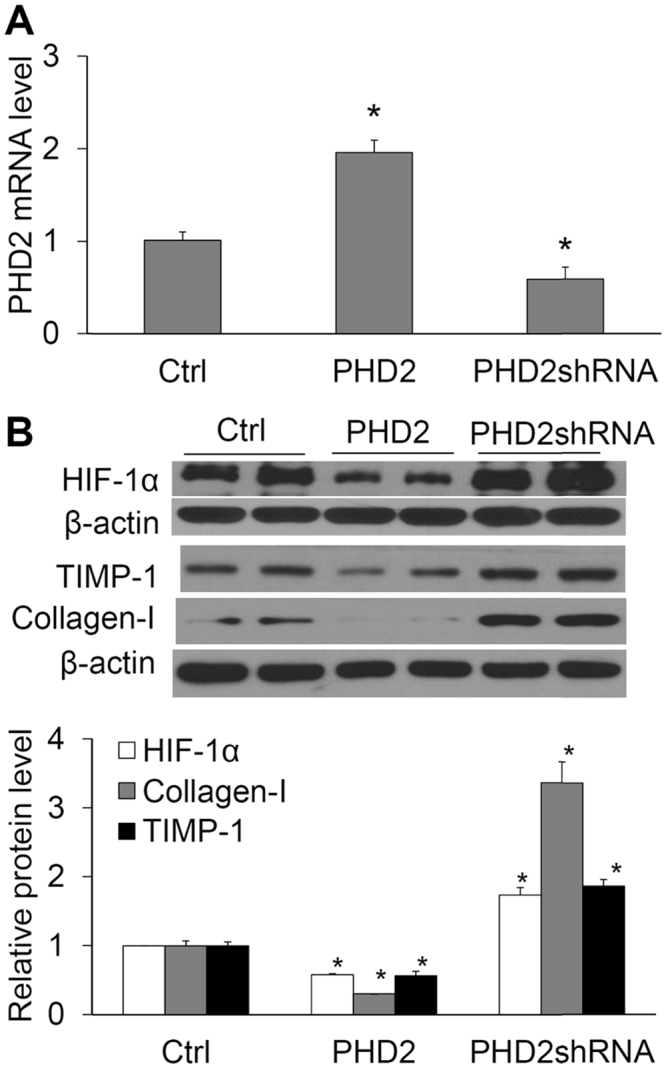
Effect of PHD2 transgene or PHD2 shRNA on the mRNA levels of PHD2 and the protein levels of HIF-1α, collagen I and TIMP-1. (A) The relative mRNA levels of PHD2 by Real-time RT-PCR analysis. (B) Protein levels of HIF-1α, collagen I and TIMP-1. Upper panel: Representative gel documents. Lower panel: Summarized data showing band intensity ratio of HIF-1α, collagen I and TIMP-1 to β-actin normalized to the value in Ctrl. Ctrl, cells treated with control plasmids. PHD2, cells treated with plasmids expressing PHD2. PHD2 shRNA, cells treated with plasmids expressing PHD2 shRNA. n = 6 batches of cells, *P < 0.05 vs. other two groups.