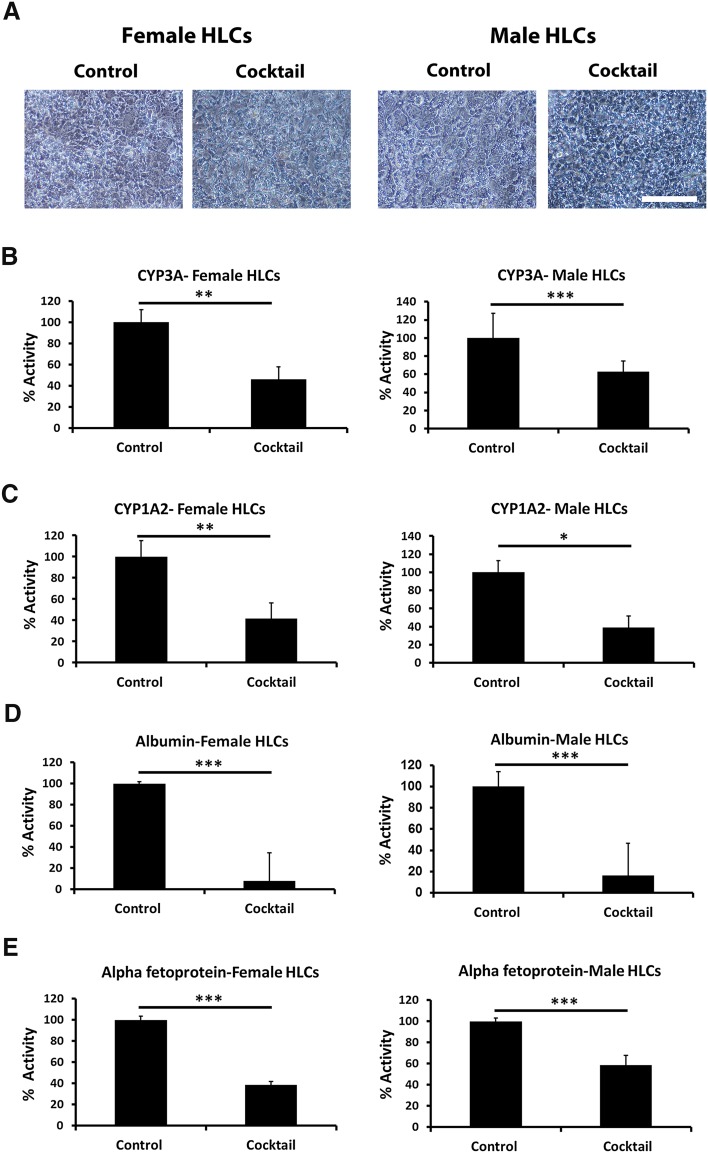
Fig. 4.
Cell morphology and metabolic activity following smoking component exposure. a Phase contrast images reveal a deterioration in the cell morphology in the presence of the mixture of drugs for 8 days compared with cells in the presence of the vehicle control. b, c pGLO™ technology was employed to measure cytochrome P450 activity. d, e ELISA was employed to study the secretion of albumin and alpha-fetoprotein. The images were taken at ×10 magnification and scale bar represents 200 μm. Levels of significance were measured by Student’s t test. The experiments are representative of five biological replicates

