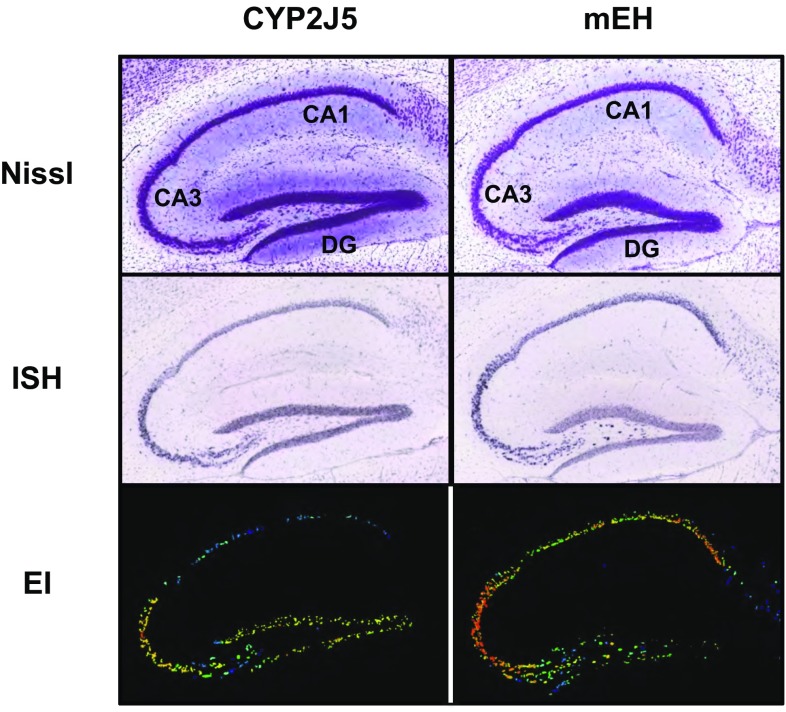
Fig. 2.
CYP2J5 and mEH expression in the adult mouse hippocampus. In situ hybridization analysis of CYP2J5 and mEH mRNA expression (middle row), compared with (upper row) and normalized to (lower row) a general nucleic acid staining in the adult mouse hippocampus. Pictures represent sagittal sections taken from the Allen brain atlas (link: http://mouse.brain-map.org), specifically experiments 513,229 (CYP2J5) and 68,498,247 (mEH) (Lein et al. 2007). Note that the expression levels for both mRNAs are highest in the CA3 region of the hippocampus and indicate strong expression in the principal neurons of this region. CA1 cornu ammonis area 1, CA3 cornu ammonis area 3, DG dentate gyrus, EI expression index (ISH signal intensity normalized to Nissl staining); ISH in situ hybridization with specific antisense probes, Nissl Nissl staining for nucleic acids

