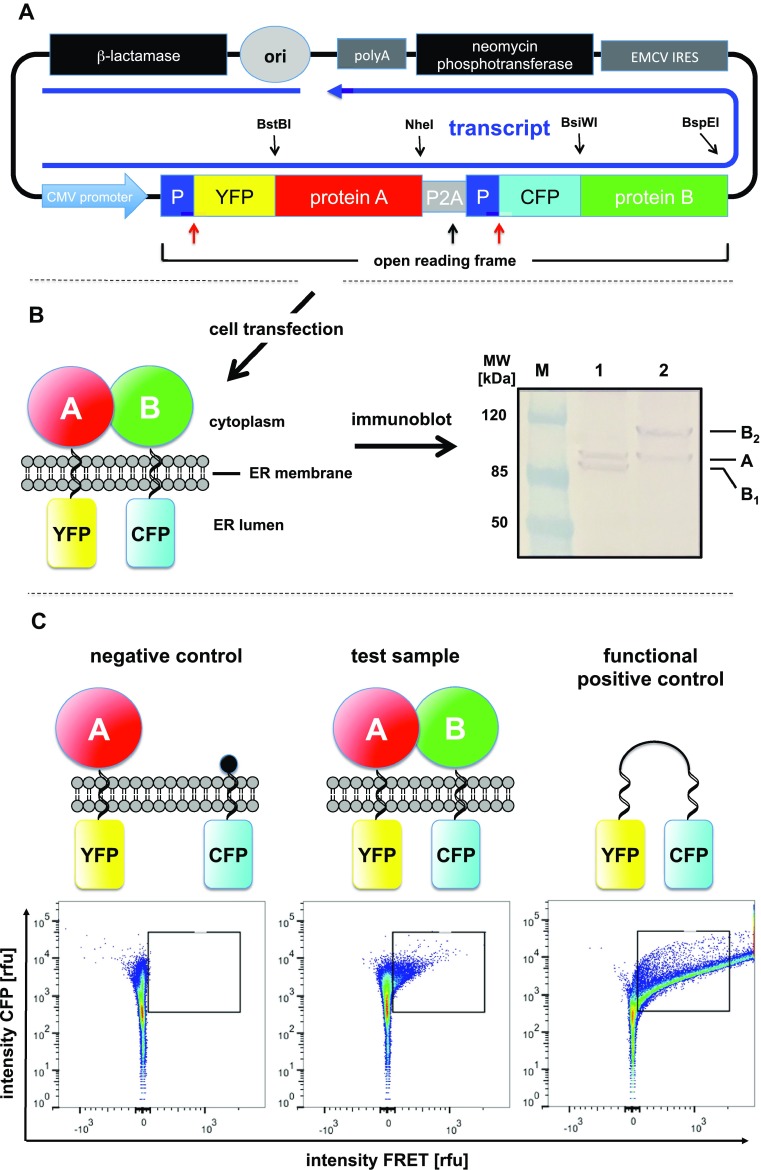
Fig. 3.

Experimental strategy for FAMPIR. a Design of the expression vector. The essential core element is an open reading frame that allows the simultaneous production of two transmembrane proteins from a single start codon, mediated by a P2A peptide sequence (gray box). The skipped peptide bond is indicated by a black arrow. Signal peptides derived from the human ApoE gene (dark blue boxes marked by “P”) direct the N-termini of the mature recombinant proteins into the ER lumen and are cleaved off during translation (cleavage sites are indicated by red arrows). Thus, the two FRET partners YFP (yellow box) and CFP (cyan box) are translocated into the lumen of the ER during protein synthesis. Their coding sequences are followed in frame by the native ORFs of the two type I transmembrane proteins (red and green boxes) to be analyzed for their interaction. Their native N-terminal signal sequences remain uncleaved and act as stop transfer signals during translation, thus resulting in a cytoplasmic orientation of the resulting proteins. The transcription of the single RNA coding for all these elements is under the control of the strong cytomegalovirus promoter (CMV; light blue box). Note that the coding sequences for the type I membrane proteins to be analyzed by FAMPIR can be conveniently exchanged using the indicated unique restriction sites. b Expression products resulting after transfection of cells. The resulting membrane topology of proteins expressed from the above construct is shown on the left. On the right, an immunoblot analysis of cell lysates obtained after transfection with two different constructs are shown. Lane 1: CYP2J5 (A) and mouse mEH (B1); lane 2: CYP2J5 (A) and mouse CYP reductase (B2). An anti-GFP antibody was used for immunostaining. c FACS-FRET analysis. Results of FACS-FRET analyses are displayed as diagrams with FRET intensity plotted against CFP fluorescence intensity. The protein topology of the analyzed samples is shown above each diagram. All diagrams are based on authentic data derived from the following samples: Negative control—coexpression of YFP–CYP2J5 with CFP-membrane anchor only; test sample—coexpression of YFP–CYP2J5 with CFP–mEH; functional positive control—fusion protein of YFP and CFP expressed in the cell cytoplasm
