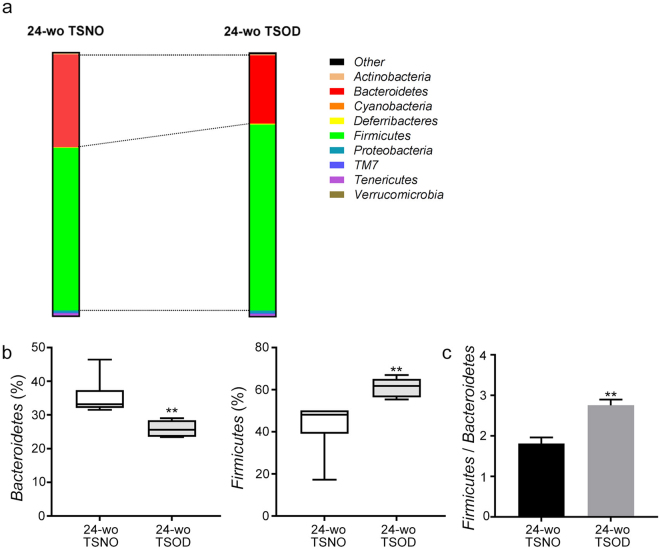
Figure 2.
Analysis of fecal bacteria at the phylum level. (a) Composition of fecal bacteria at the phylum level in 24-wk-old TSOD mice and age-matched TSNO mice. (b,c) Comparison of the percentages (b) and ratio (c) of the obese microbiota Firmicutes and the lean microbiota Bacteroidetes in 24-wk-old TSOD mice and age-matched TSNO mice. (b) Boxes indicate the interquartile ranges between the first and third quartiles, and the lines within the boxes indicate the medians. If no error bars appear, the experimental error was smaller than the symbol itself. (c) Data are means ± SEM (n = 6). **P < 0.01 versus TSNO mice.

