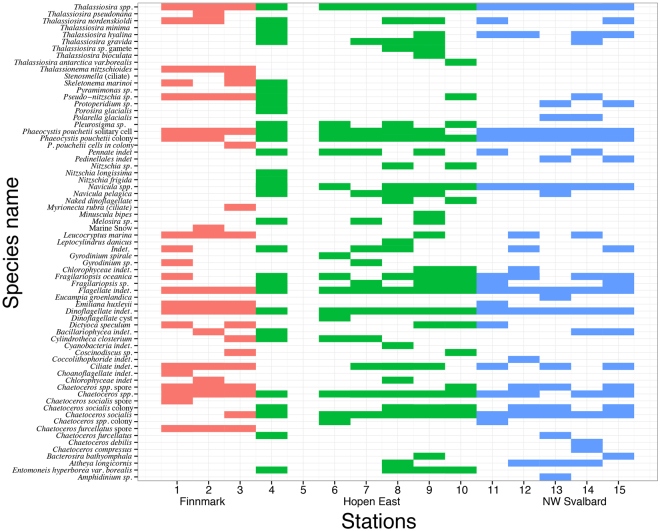
Figure 2.
Observed presence/absence of species in water samples collected at the sampling stations from the different areas. The x - axis represents station number, while the y – axis shows species, ordinated alphabetically and by station number. The three colours represents sampling area and colour fill/no fill indicates presence/no presence (red: Finnmark, green: Hopen East and blue: NW Svalbard). Note that the position of station 4 and 5 was identical (the WP-2 sample from this station was split into a zooplankton and phytoplankton component, and the zooplankton part does not contain phytoplankton species, see methods section). Note also that “marine snow” is not a species, but rather aggregates of particulate matter. In addition, keep in mind that these observations were based on Niskin bottle samples, not the biomass samples.

