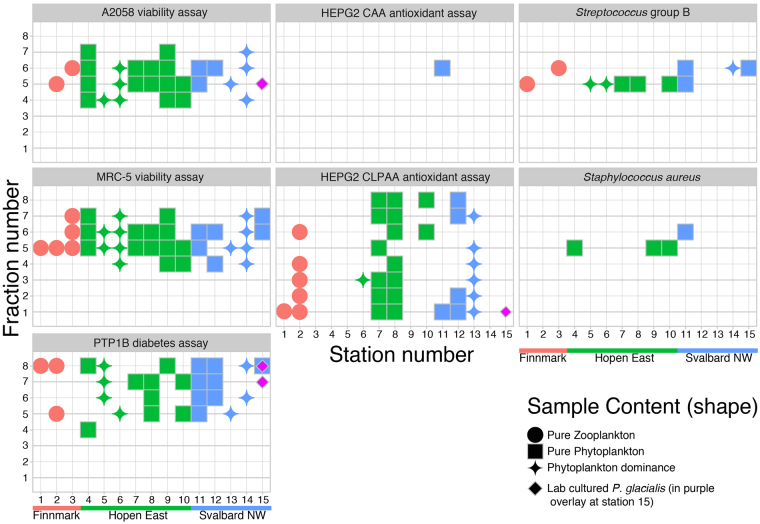
Figure 3.
Overview of all the active fractions or “hits” in each assay in relation to the three sampling areas, sample content, station number (1–15) and fraction number (1–8) Station number is on the x - axis, while fraction number is found on the y - axis. The text in grey panels shows assay name. Red colour denotes Finnmark (stations 1–3), green colour is Hopen East (stations 4–10) and blue colour is Svalbard North West (stations 11–15). One sample per station, sample number and station numbers are the same. Geometric shapes indicate sample content: circles are solely zooplankton; squares are solely phytoplankton, while the stars denote samples dominated by phytoplankton with some zooplankton present. Please note that photobioreactor cultured P. glacialis activity is shown as purple overlay at station 15. Activity thresholds for the different assays are found in the methods section. The assay result category “Weak active” (see Supplementary Table S2) is not included in this figure. Note that only the PTP1B hits that were inactive in the TC-PTP1B assay are included in the figure. T-cell PTP1B inhibition (activity) is not desired and therefore the samples active in both the PTP1B assay and the TC-PTP1B assay are not interesting for anti-diabetic purposes.

