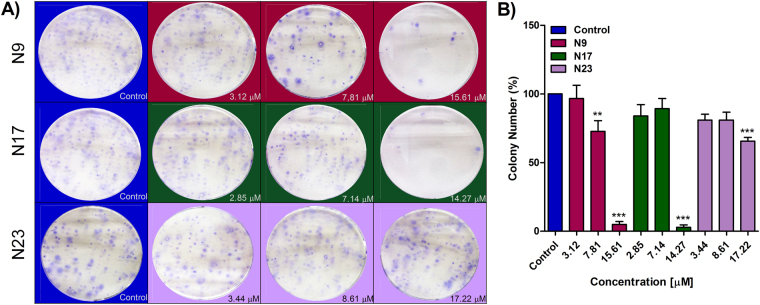
Figure 1.
(A,B) Effects of chalcones N9, N17 and N23 in the clonogenic assay. (A) Representative images of the clonogenic assay; HN30 cells were treated with the chalcones N9 (red panels; 3.12 µM, 7.81 µM and 15.61 µM), N17 (green panels; 2.85 µM, 7.14 µM and 14.27 µM) and N23 (lilac panels; 3.44 µM, 8.61 µM and 17.22 µM), for 48 h. After this period, the cells were maintained in a drug-free medium for 12 days. (B) Bar chart demonstrating the percentage of colony numbers of HN30 cells after 12 days. Data represent the mean of 3 independent experiments, performed in duplicate, and the lines indicate the standard error mean. Data were analyzed by one-way ANOVA, followed by Dunnet’s post-test; the group A represents the negative control. Significantly different from the control group (*P < 0.05); (**P < 0.01), (***P < 0.001).

