Figure 2.
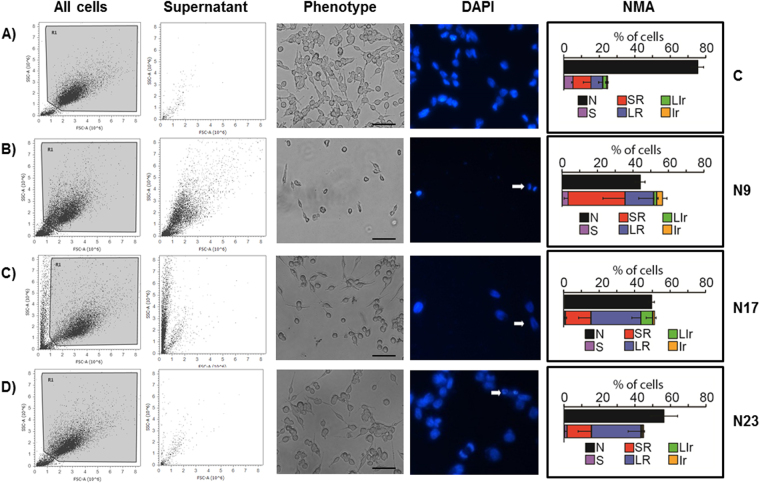
(A,D) Effects of chalcones N9, N17 and N23 on phenotypic characteristics and cell death of HN30 cells. The HN30 cells were treated with the chalcones N9 (15.61 µM), N17 (14.27 µM) and N23 (17.22 µM), for 48 h. (A) Control cells. (B) Cells treated with chalcone N9. (C) Cells treated with chalcone N17. (D) Cells treated with chalcone N23. The first and the second columns represent all cells or the supernatant of the cells analyzed by flow cytometry, respectively. The third column shows the morphology of the cells on microscopy and the fourth column the cell staining with DAPI. The white arrows represent cells in apoptosis. The last column shows the NMA analysis. N: Normal nuclei, Ir: irregular, LR: Large Regular; LIr: Large Irregular; SR: Small and Regular; S: Small.

