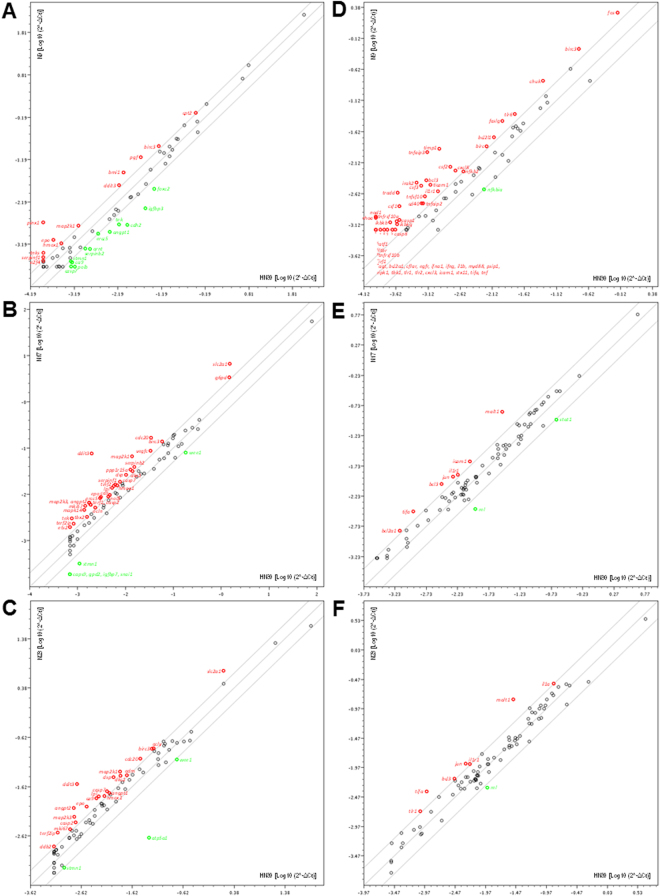
Figure 8.
(A,F) Analysis of gene expression profile of quinoxalinic chalcones (N9, N17 and N23) using PCR array. Scatter plots show the up-regulation (red dots) or the down-regulation (green dots) of genes related to cancer-related pathways (A – chalcone N9; B – chalcone N17; C – chalcone N23) and NFκB-mediated signal transduction (D chalcone N9; E – chalcone N17; F – chalcone N23) using real-time PCR via ‘Human Cancer PathwayFinder PCR Array’ and ‘Human NFκB Signaling Pathway plus PCR Array’. Changes in gene expression were calculated using the 2^-ΔCt method (RT2Profiler PCR array Data Analysis v3.5 - SABio/QIAGEN), and five stably expressed housekeeping genes (B2M, Hprt1, Rpl13α, Gapdh, and β-actin) were used for normalization of the results.

