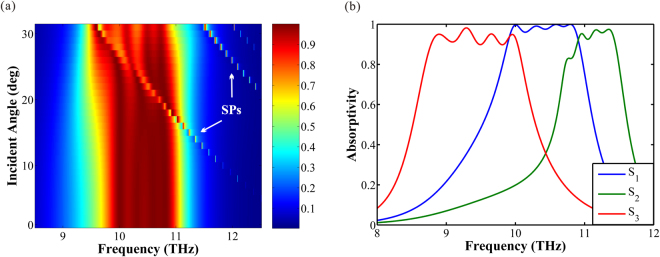
Figure 8.
(a) Absorption spectra as a function of incident angle. The color bar represents the value of absorption. (b) Absorption spectra as a function of different Fermi level (E f). The Fermi level of ribbon r 1~r 4 is assumed as E f1~E f4. The Fermi level of each curve: S1, E f1 = E f2 = E f3 = E f4 = 0.64 eV; S2, E f1 = 0.75 eV, E f2 = 0.73 eV, E f3 = 0.71 eV, E f4 = 0.70 eV; S3, E f1 = 0.53 eV, E f2 = 0.54 eV, E f3 = 0.54 eV, E f4 = 0.54 eV.

