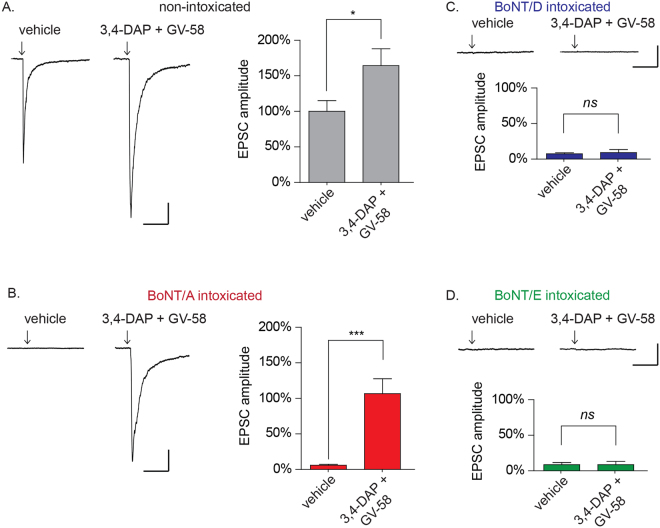
Figure 5.
3,4-DAP plus GV-58 restores evoked neurotransmission to baseline levels in cultured neurons intoxicated by BoNT/A, but not BoNT/D or BoNT/E. Representative EPSC and mean EPSC amplitudes from cultures intoxicated with: (A) vehicle; (B) BoNT/A; (C) BoNT/D; or (D) BoNT/E. Arrows represent stimulation times. Scale bars represent 400 ms (x-axis) and 100 pA (y-axis). Mean EPSC amplitudes are presented as mean ± SEM; n ≥ 13 recordings for 5A-B and n ≥ 9 recordings for 5C–D. *Indicates p < 0.05, ***Indicates p < 0.001, ns = not significant.

