Figure 2.
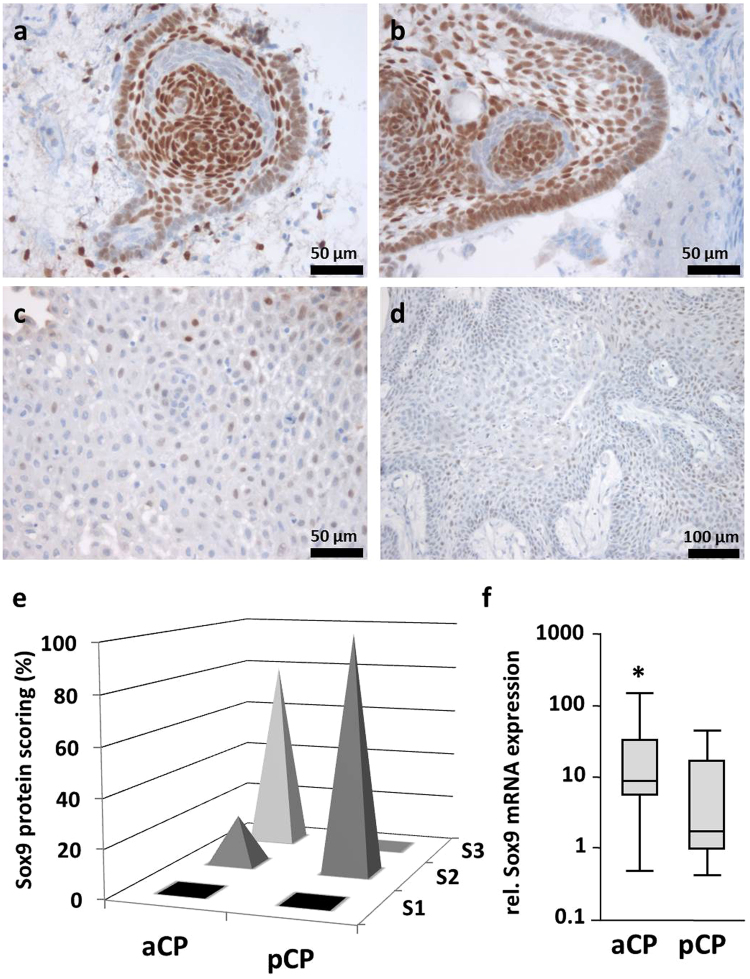
Immunohistochemical Staining of Sox9 in CP Subtypes and Summary of Calculated Sox9 Staining Scores. (a,b) Sox9 expression in aCP was not evenly distributed throughout the tumour, but rather showed significant regional differences (ada57). Although large proportions of the cells demonstrated a distinct nuclear staining pattern, small cell clusters in the direct vicinity were clearly negative. (c,d) Homogeneous and moderate immunohistochemical staining pattern of Sox9 in pCP (pap3, pap5). (e) The spikes illustrate the percentage shares of the immunohistochemical scoring groups (S1 = “no expression”; S2 = “low/moderate expression”; S3 = “strong expression”) within aCP and pCP specimens studied. Nuclear Sox9 staining was found in each of the 73 CP samples. Whereas all pCP samples showed only a moderate Sox9 expression (100% in group S2), aCP revealed expression in varying intensities (20.3% in group S2 and 79.7% in group S3) with a significantly higher overall Sox9 expression in this subtype [Fisher’s exact test (two-sided): p < 0.0001]. Exact values for each tumour sample were given in S-Table 1. (f) Sox9 mRNA expression analysis confirmed significantly enhanced levels in aCP (n = 26; mean = 24,47 in relation to pCP (n = 7; mean = 10,18; Mann-Whitney test, p = 0,0484).

